COPYRIGHT
© Copyright: 2011-2020 by www.Smart-Accredit.com Worldwide rights of ownership and distribution of the software packages released with the name CLOSO™ and “Smart-Accredit CLOSO” rest with www.Smart-Accredit.com, 3504 88th Ave SE, 15-332, Mercer Island, WA 98040, USA. CLOSO™, Smart-Accredit CLOSO and all associated documentation are proprietary products. Unlicensed use of the program or reproduction of the documentation in any form or by any means, without prior written permission from www.Smart-Accredit.com, is explicitly prohibited. Note: All trademarks used in the manual are the property of their respective owners.DISCLAIMER
Considerable expenses, time and effort have gone into the development of Smart-Accredit CLOSO™ or CLOSO software. In using the software, however, the user accepts and understands that no warranty is expressed or implied by the developers or the distributors on the accuracy or the reliability of the program. The authors and the distributors hereby disclaim any liability to any party for any loss or damage resulting from the installation or use of CLOSO™. Smart-accredit.com or any of its resellers makes no representations or warranties with respect to the content hereof and specifically disclaim any implied warranties of merchantability or fitness for any particular purpose. The user must independently verify the results obtained by this software. Smart-accredit.com also reserves the right to revise this publication and make changes from time to time in the content hereof without any obligation to Smart-Accredit.com to notify any person or organization of such revision or change.1 INTRODUCTION
For getting accredited by ABET, an academic program has to produce a self-study report (SSR). The SSR provides data to show how well the program is meeting the established criteria specified by ABET. Among these criteria, the “Continuous Improvement” criterion spans all other criteria and is considered as the most important. An academic program must prove that Continuous Quality Improvement (CQI) processes exist and are effective. These processes ensure the improvement of the quality of education to keep the attainment of students’ learning outcomes at a satisfactory level.
An effective CQI plan is based on two types of assessments: direct and indirect. Direct assessment involves assessment of students’ abilities through examinations, assignments, projects, presentations, and so forth. Indirect assessment is based on surveys and interviews like the student survey at the end of a course, faculty surveys, and exit interviews.
The data from direct and indirect assessments in various courses must be collected and evaluated. Both, data collection and evaluation processes are time consuming and laborious if done manually. These processes, involving data collection and evaluation, need to be automated to save the time of instructors, accreditation coordinators and chairpersons of the academic program.
“Smart-Accredit CLOSO” (Smart system for Accreditation through evaluation of Course Learning Outcomes & Student Outcomes) automates the assessment data collection and evaluation of learning outcomes. It automates the evaluation of CLO and SO satisfaction and produces complete course folders for instructors. It also produces error-free evaluation and generates high quality reports required for accreditation. CLOSO is a highly reliable system that produces the critically required data for academic accreditation. The software plays a key role in the critical decision-making required to improve the learning outcomes of students.
CLO and SO are the terminologies adopted in this manual and set in the software by default. However, the software allows the administrator to customize these terminologies and use the ones prevalent at the institution.1.1 Aims & Motivations
Development of CLOSO software was motivated by a clear demand of a software that automates the CQI processes for accreditation of academic programs and reduces the work load on the faculty in preparing the course folders. Automation was required in the following tasks:
- a) Preparation of course folders
- b) Quantitative evaluation of assessment data
- c) Analyses of CQI processes as required for accreditation
- d) Decision support for chairpersons and other administrators
At the time CLOSO development began, in 2009, no software package was available that automated these processes. And yet, no other software exists with the options and features available in CLOSO.
CLOSO was developed to achieve drastic time saving for instructors and accreditation coordinators and to provide the department with user-friendly decision support system. Developed with the above objectives and motivations, the following aims were achieved and built into the software:
- 1. Instructor’s Time Saving: The instructor’s time saving is drastic. The whole course folder can be finished within 2-3 hours at the end of the academic term with all data, analyses, and evaluation required for accreditation.
- 2. Administrator’s Time Saving: The time saving for the accreditation coordinators and the chairpersons is even more drastic. Data from all course folders are gathered automatically with a click of the mouse. All analyses and comparisons are done automatically.
- 3. Accuracy & Reliability: Error-free data is produced for the SSR to be submitted to the accreditation agency.
- 4. User-Friendly: A remarkable user-friendly interface works as a self-learning tool with easy data entry mostly with mouse-clicks.
- 5. Satisfaction Data: “Satisfaction Data” is produced for each CLO and SO. It is something unique and strong feature for helping the department in the continuous improvement process.
- 6. Students' Survey: Students’ survey data are analyzed to evaluate the students’ perception of their abilities in the course learning outcomes.
- 7. Instructor’s Feedback: Instructors opinions on various aspects of educational quality are gathered through several faculty survey options and the data are analyzed.
- 8. Grade Normalization: Outcome-based curve-up or down of the grades is an option that helps the instructors and the department in grade normalization. Grade normalization increases the reliability of the outcome attainment data.
- 9. Unified Database: A unified database manages the curriculum and assessment data.
- 10.Student Work Samples Integration: Scanned copies of student work samples for each course are integrated in the course folders produced by CLOSO.
1.2 Learning CLOSO
CLOSO has a powerful visual interface and has been designed to be a self-learning tool. Most users learn to use CLOSO software just by trying it without any manuals. Despite the efforts to make CLOSO a self-learning tool, it is supported by this manual. However, users may have questions while using the software. Technical support is available free of cost to all users of CLOSO. They are encouraged to contact the technical support whenever they need any assistance.
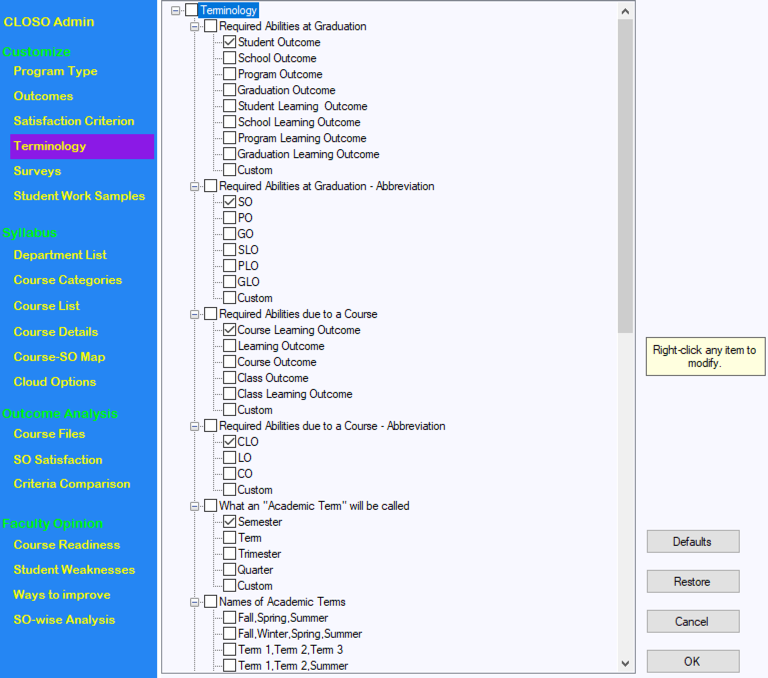
2 TERMINOLOGY
CLOSO terminology can be customized. Most of the terms used in the input pages of CLOSO can be modified by the CLOSO administrator to suit any a cademic program, department or university. In this chapter, CLOSO’s default terminology is briefly described.
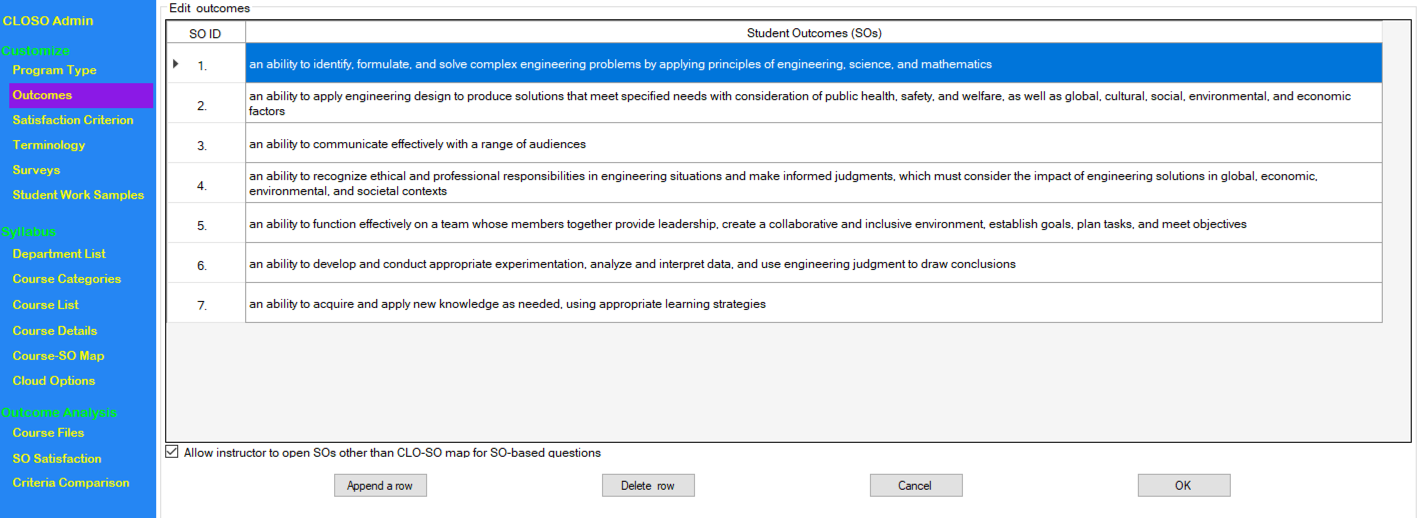
2.1 Student Outcomes (SOs)
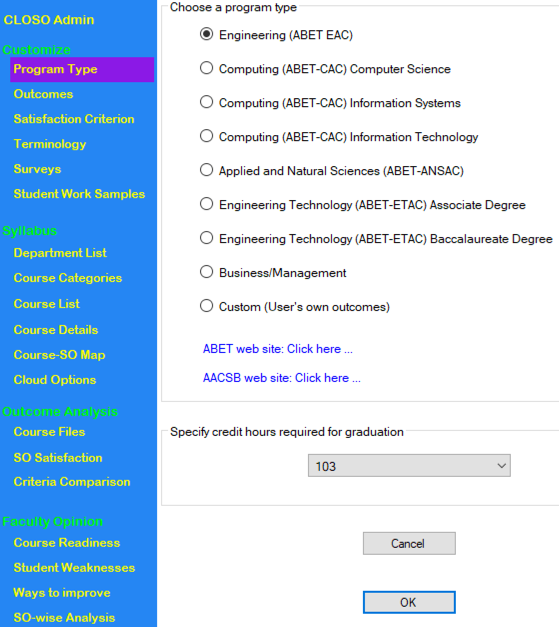
ABET uses the term “Student Outcomes” (SOs) to describe the abilities students must acquire by the time of graduation. Each accreditation commission of ABET has a different set of SOs. The user may choose from the following sets of SOs corresponding to different ABET commissions:
- 1. Engineering (ABET - EAC)
- 2. Computing Sciences (ABET - CAC)
- 3. Applied Sciences (ABET - ASAC)
- 4. Engineering Technology (ABET - ETAC)
After selecting any one of the above sets, the CLOSO administrator may modify them to comply with the requirements of an academic program. CLOSO gives the program administrator all the flexibility needed to specify the student outcomes.
2.2 Course Learning Outcomes (CLOs)
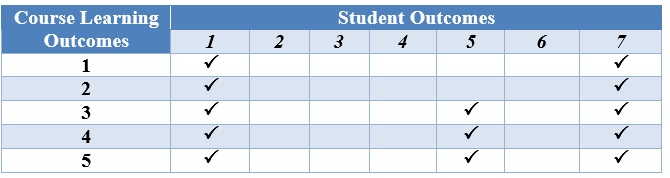
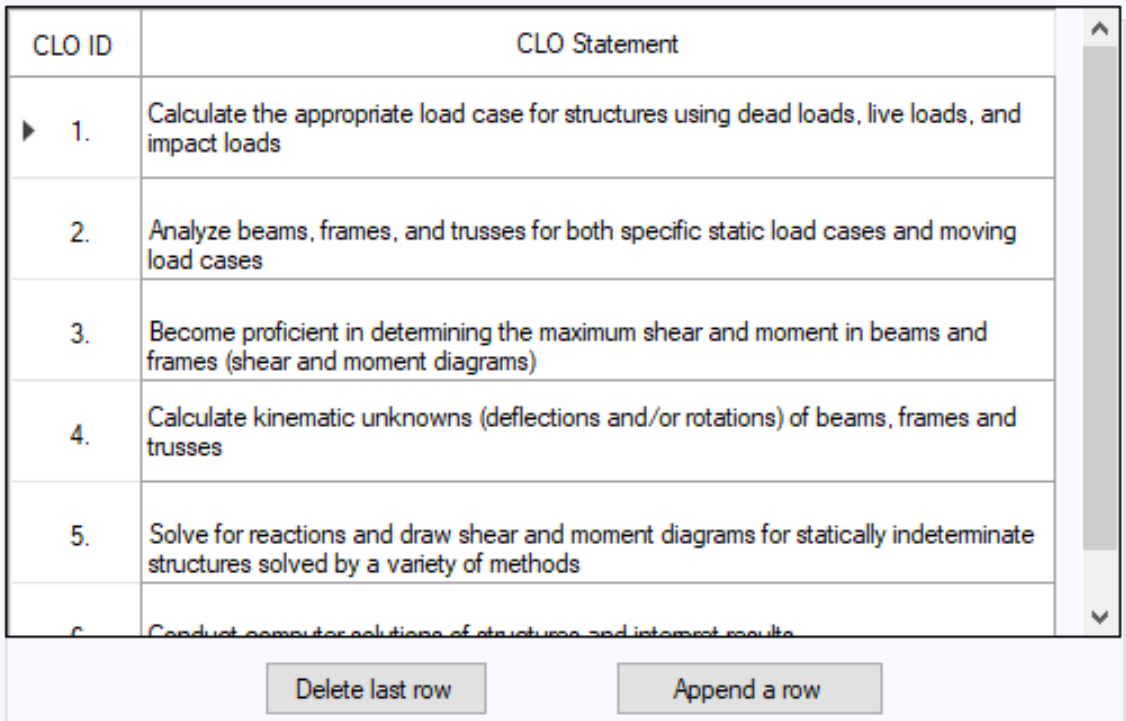
Course Learning Outcomes (CLOs) are specific to a course and describe the course-related abilities students will acquire through the course. CLOs are distinct, non-overlapping and targeted to specific course-related skill levels. They must also be measurable through direct assessments. The questions asked in direct assessments, like quizzes, homework and examinations, always target one or more of the CLOs. The curriculum of an academic program seeking accreditation must have CLOs documented for all courses. Fig. 1 shows an example of CLOs for a course.
- 1. An ability to analyze/design electromagnetic circuits/devices
- 2. Knowledge of electromagnetic energy conversion principles
- 3. An understanding of the time-varying systems
- 4. An ability to analyze dc machines
- 5. An understanding of converters for dc drives
2.3 CLO-SO Map
SOs are not usually targeted directly in direct assessments. Most direct assessments in a course target CLOs prescribed for that particular course. Students attain the abilities represented by the SOs through the abilities represented by CLOs in various courses. To identify those SOs that are attained through the CLOs for a particular course, a CLO-SO map is required. For example, CLO1 in Fig. 1 is: “An ability to analyze/design electromagnetic circuits/devices”. This CLO requires the use of mathematics, science and engineering. Therefore, it maps to SO “1”: “an ability to identify, formulate, and solve complex engineering problems by applying principles of engineering, science and mathematics”. The same CLO also requires an ability to use software that facilitates analysis and designing. Since the use of software is categorized as a modern engineering tool, CLO1 also maps to SO “7”: “an ability to acquire and apply new knowledge as needed, using appropriate learning strategies”. The complete CLO-SO map for the course is shown in Fig. 2
CLOs shown in Fig. 1 depend upon the contents and the objectives of a course as outlined in the course syllabus. It may be noted here that it is quite possible that the same course in two different institutions have different sets of CLOs, and consequently, the CLO-SO map may also differ. It depends upon the syllabus of the course as documented in the curriculum of the academic program.
2.4 Assessment
Students’ abilities have to be evaluated through assessments like homework assignments, examinations, quizzes, term-projects and presentations. CLOSO administrator for the department can choose a different name for the word “assessment” using the customization option of CLOSO.
2.5 Terms
By default, CLOSO uses the terms “Fall”, “Winter” “Spring” and “Summer”. CLOSO administrator for the department may specify terms other than these to suit the academic program.
2.6 Academic Year
CLOSO uses the format xxxx-xx to indicate an academic year e.g., 2020-21.
2.7 Raw Score
Raw score is what a student obtains in a single assessment. The actual contribution of the assessment towards the final grade may be different. For example, an assessment could be designed such that it is graded out of 20. However, its contribution or weight towards the final grade may be 5%. In this case, the score out of 20 is called the raw score for the assessment. Both of the terms “Raw” and “Score” can be replaced by other terms using CLOSO customization module.
2.8 Final Grade
CLOSO uses the term “Final Grade” for the total score out of 100 earned by a student in a course. It can be replaced by any other term using CLOSO customization module.
3 INSTALLATION
CLOSO is easy to install and should not take more than five minutes. Your department’s CLOSO administrator will obtain client login details from sales@smart-accredit.com. CLOSO administrator will send you the client login ID and password. You may then begin the installation on your PC.
If you do not have a license, you can still use the software, but with limitations. Without a license, CLOSO will be in demo mode. Printing will be disabled and CLOSO will allow you up to four courses. In the demo mode, you can open the Admin Panel to get a good idea of the kind of analysis CLOSO can do for you.
3.1 Download and Install CLOSO
Your CLOSO Administrator will send you the client login ID and password. To download CLOSO, do the following:
- 1) Open your browser and go to www.smart-accredit.com.
- 2) Click “Client Portal”.
- 3) Select “Client Login/Download.”
- 4) Enter the login ID and password.
- 5) A new page will open. The bottom of the page will have the download links:
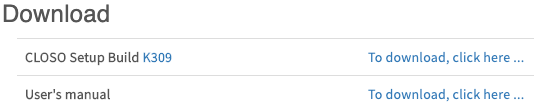
- 6) Click to download CLOSO Setup file.
- 7) Click the downloaded file to start installation and follow the instructions.
- 8) A new icon will be placed on the desktop as shown below:

3.2 Starting CLOSO
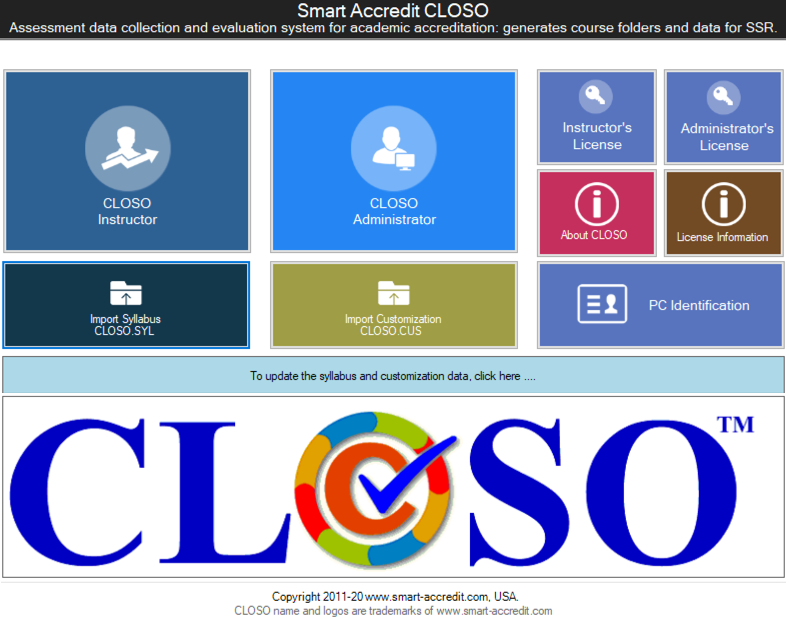
CLOSO setup will create an icon on the desktop and also in the start menu of Windows. Double-click the icon to start the program. The “Main CLOSO window”, shown in Fig. 3, will appear.
3.3 License Activation
To activate the license, do as follows:
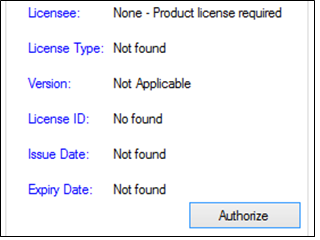
- 1) On the CLOSO main window, click “Instructor’s License”:
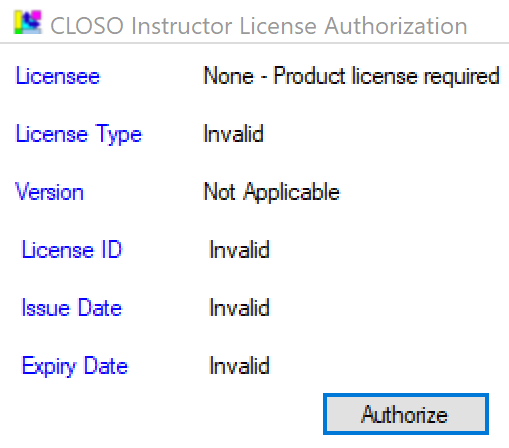
- 2) Click the “Authorize” button as shown below:
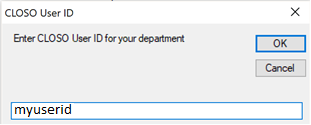
- 3) CLOSO will ask you to enter the department’s CLOSO User ID. Enter the User ID and click OK:
- 4) A message will appear as follows:
- 5) Restart CLOSO.
3.4 Syllabus Import
To import the syllabus data file, do as follows:
- 1) On the CLOSO main window, click the following icon:
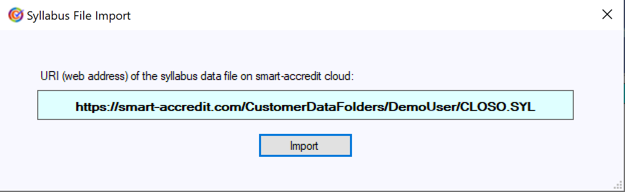
- 2) Syllabus File Import page will open. Click the “Import” button:
- 3) You will receive a message as follows:
3.5 Customization Import
To import the customization data file, do as follows:
- 1) On the CLOSO main page, click the following icon:
- 2) Repeat Steps 2 and 3 as above for Syllabus Import.
4 COURSE INFO
This chapter describes the instructor’s course information input. Clicking the Instructor Input icon in the Main Window of CLOSO opens “CLOSO Instructor” window as shown in Fig. 4. The first set of commands in the left panel is related to the Class Information.
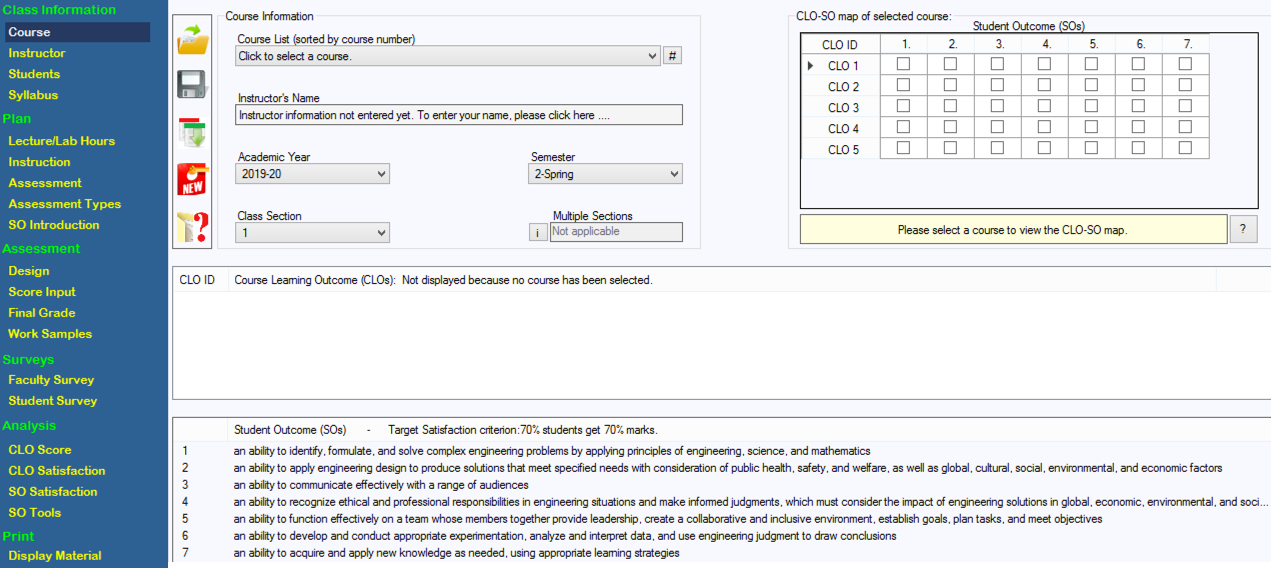
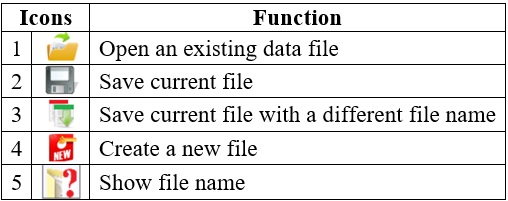
4.1 Saving, Opening and Creating Files
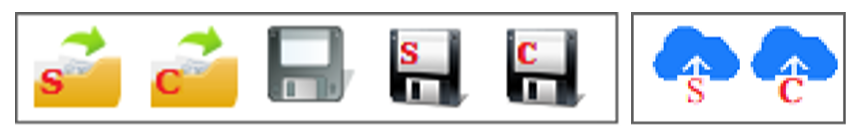
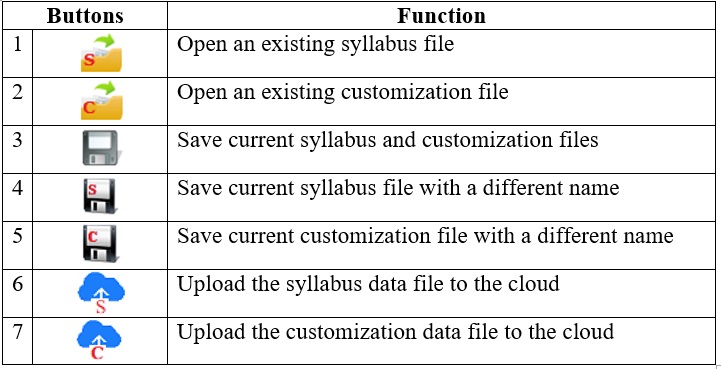
Table 1 gives the commands that can be accessed through the icons on the icon panel.
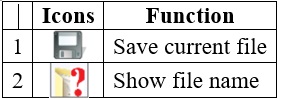
Two of these icons can also be found at the very bottom of the left panel. These icons are always visible, except when the user is in the Course Information page. Table 2 gives the commands that can be accessed through the icons at the bottom of the left panel.
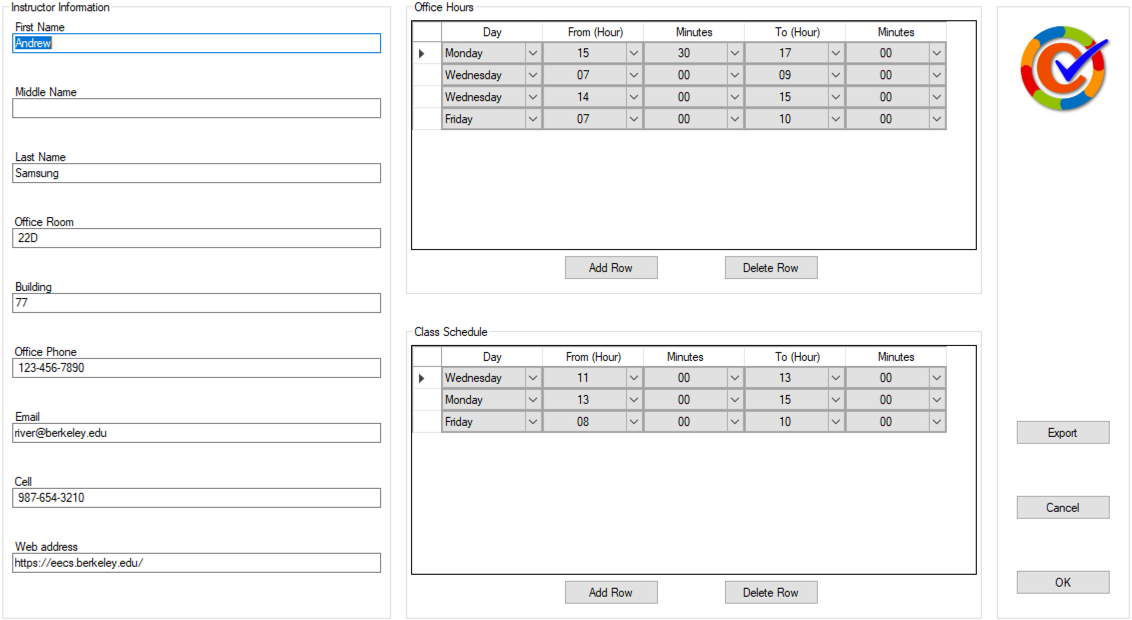
4.2 Instructor Information
To enable course information, instructor information is required. To do this, click “Instructor” in the left panel menu of the Instructor Panel. The Instructor Information page will open, shown in Fig. 5.
To enter office hours and class schedule, one row is initially displayed. You may add as many rows as you like by clicking the “Add Row” button.
4.3 Course Information
Click “Course” in the left panel to return to the main page of the Instructor Panel. Enter the following data:
- 1. Course Number and Name: Click and select a course from the dropdown list. All the courses included in the syllabus data file will appear in the list. If your course is not in the list, contact the CLOSO Administrator. CLOs and the CLO-SO map for the selected course will be displayed.
- 2. Academic Year: The current academic year will be displayed.
- 3. Semester: Select a semester from the dropdown list.
- 4. Class Section: A course may have several sections (groups). Select the section you are teaching. If you are teaching more than one section, select “Multiple”. This is the last item in the dropdown list. Specify the sections in the data entry box on the right.
After entering Course Information, click the “Save” icon. CLOSO gives the file a name that contains the course name, the instructor’s name and other information. The file has the extension “.CLOSO”. It is not a text file and cannot be opened by a text editor. You can only open it using CLOSO.
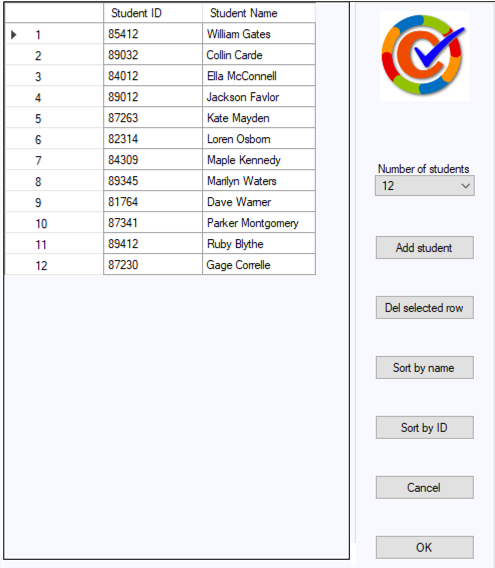
4.4 Students List
Click the label “Students” in the left panel. A data entry page will appear as shown in Fig. 6. If you have a list of students’ names and IDs stored
in EXCEL or any other application, you may copy and paste it on this page. To copy and paste, first specify the number of students. Select the columns
and then right click on any of the cells. Click “Paste”.
There is a set of controls on the right of the page to do the following operations:
- 1. Number of students: Click to specify the number of students.
- 2. Add a student: Click the button to add a row at the end of the list.
- 3. Delete selected row: Select a row and click to delete it.
- 4. Sort by name: Click to sort the list by student names.
- 5. Sort by ID: Click to sort the list by student IDs.
- 6. Cancel: Exit without saving
- 7. OK: Exit after saving the modified data
4.5 Syllabus View/Modify
The course syllabus can be viewed by clicking “Syllabus” in the left panel menu. The instructor can edit the contents, CLOs, CLO-SO map, textbook,
and other items concerning the syllabus. When the instructor modifies the syllabus, the modifications are saved in a file as suggested
modifications. The CLOSO Administrator, after receiving this file from the instructor, will incorporate them in a unified database after approval
from the department.
To modify the syllabus, do the following:
- 1. Open CLOSO.
- 2. Enter your name on the Course Information page.
- 3. Select the course you want to modify. Click the Save button. You will get a message that the user’s data has been saved.
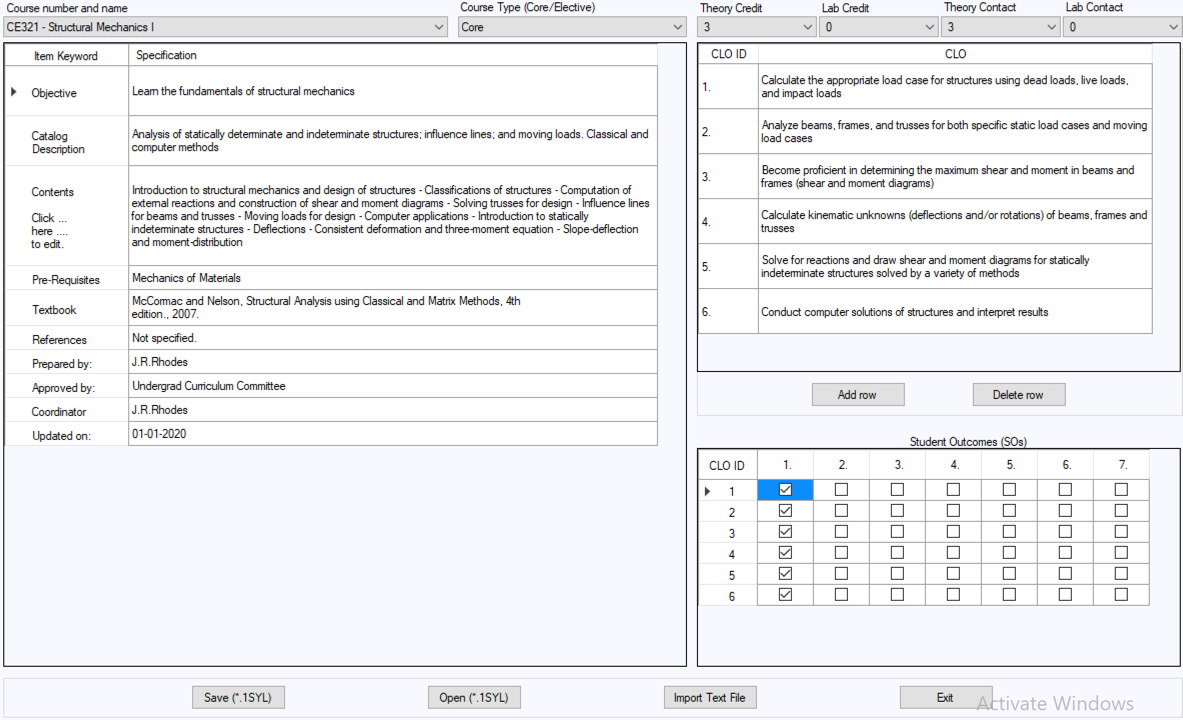
- 4. Click “Syllabus” in the left-hand panel. The Syllabus window will open as shown in Fig. 7.
Now, to modify the syllabus, there are two methods:
Method 1: Edit/type in the syllabus window
- 1. Click any item of the syllabus and edit by typing in or copy and paste from your Word or other text file.
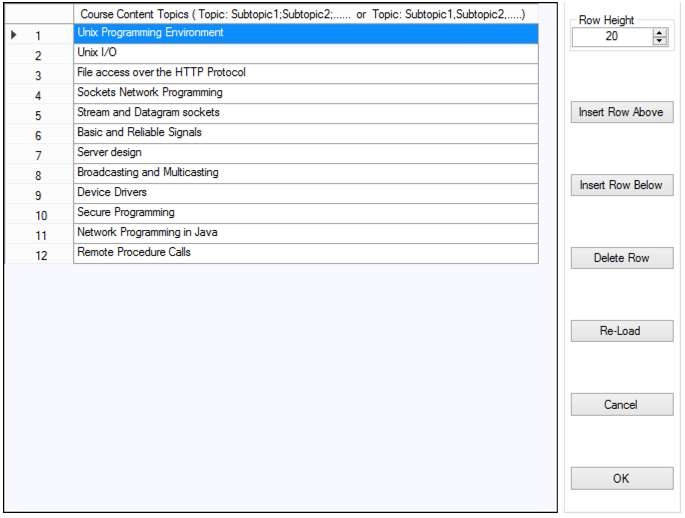
- 2. For “Contents”, a new window will open, as shown in Fig. 8. You can enter the Course Contents topic-by-topic.
- 3. For entering the CLO-SO map, just click cells of the table to check or uncheck.
Method 2: Import syllabus from a text file
- 1. Click the button “Import Text File”. Browse to the text file containing the modifications for the syllabus.
- 2. The text file must contain a keyword followed by whatever you want for that keyword item. For example, Contents is a keyword. In the text file, under Contents, put a line for each topic of the content. A sample text file is shown in Fig. 9.
- 3. Use the keyword “CLO” and put the CLOs under the keyword (each CLO in a separate line). To enter the CLO-SO map, type 1s and 0s as needed, separated by commas or space.
- 4. Use the keyword “CLOSO”. Each line of text will represent a row in the CLO-SO map. Each line will consist of 0s and 1s separated by commas or space.
- 5. When you are done with your modifications using Method 1 or Method 2, click the button “Save (*.1SYL)”
- 6. A file will be saved. Send this file to the CLOSO Administrator of your department.
The CLOSO Administrator will import this file to the Admin Panel and subsequently upload to the cloud.

5 ASSESSMENT PLAN
This chapter describes the five different components of “Plan” shown in the left panel menu of the “CLOSO Instructor Window”. The plan components are as follows:
- 1. Lecture/Lab Hours
- 2. Instruction
- 3. Assessment
- 4. Assessment Types
- 5. SO Introduction
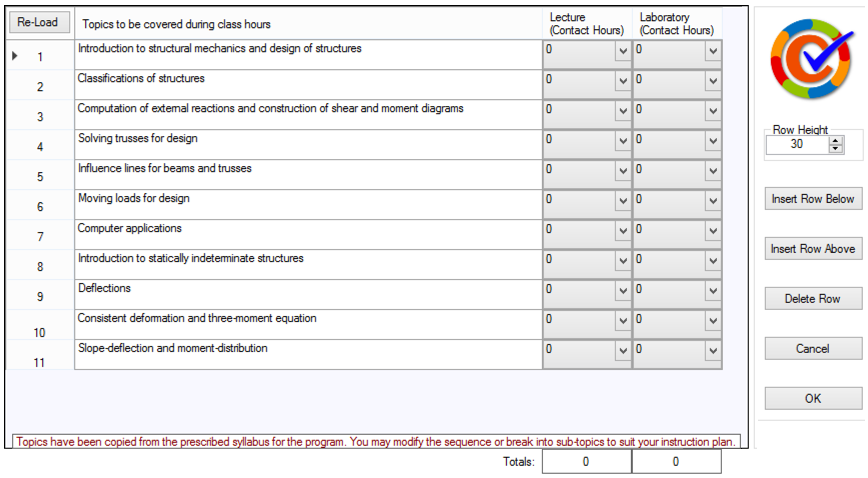
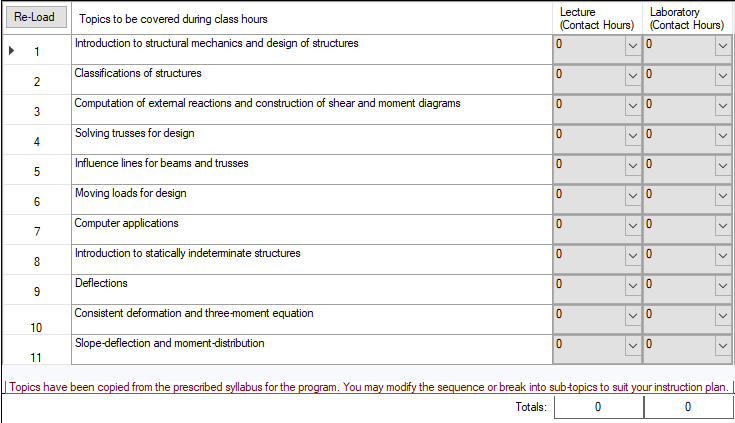
5.1 Lecture/Lab Hours
Lecture/Lab Hours page is shown in Fig. 10. The purpose of this page is to give a timeline estimate for covering the course topics. The topics to be covered during class hours are listed. The user may modify them, add more topics or delete any of them. The user can re-load the original topics from the syllabus anytime during input by clicking the “Re-load” button. For each topic, the instructor is required to provide lecture and laboratory contact hours.
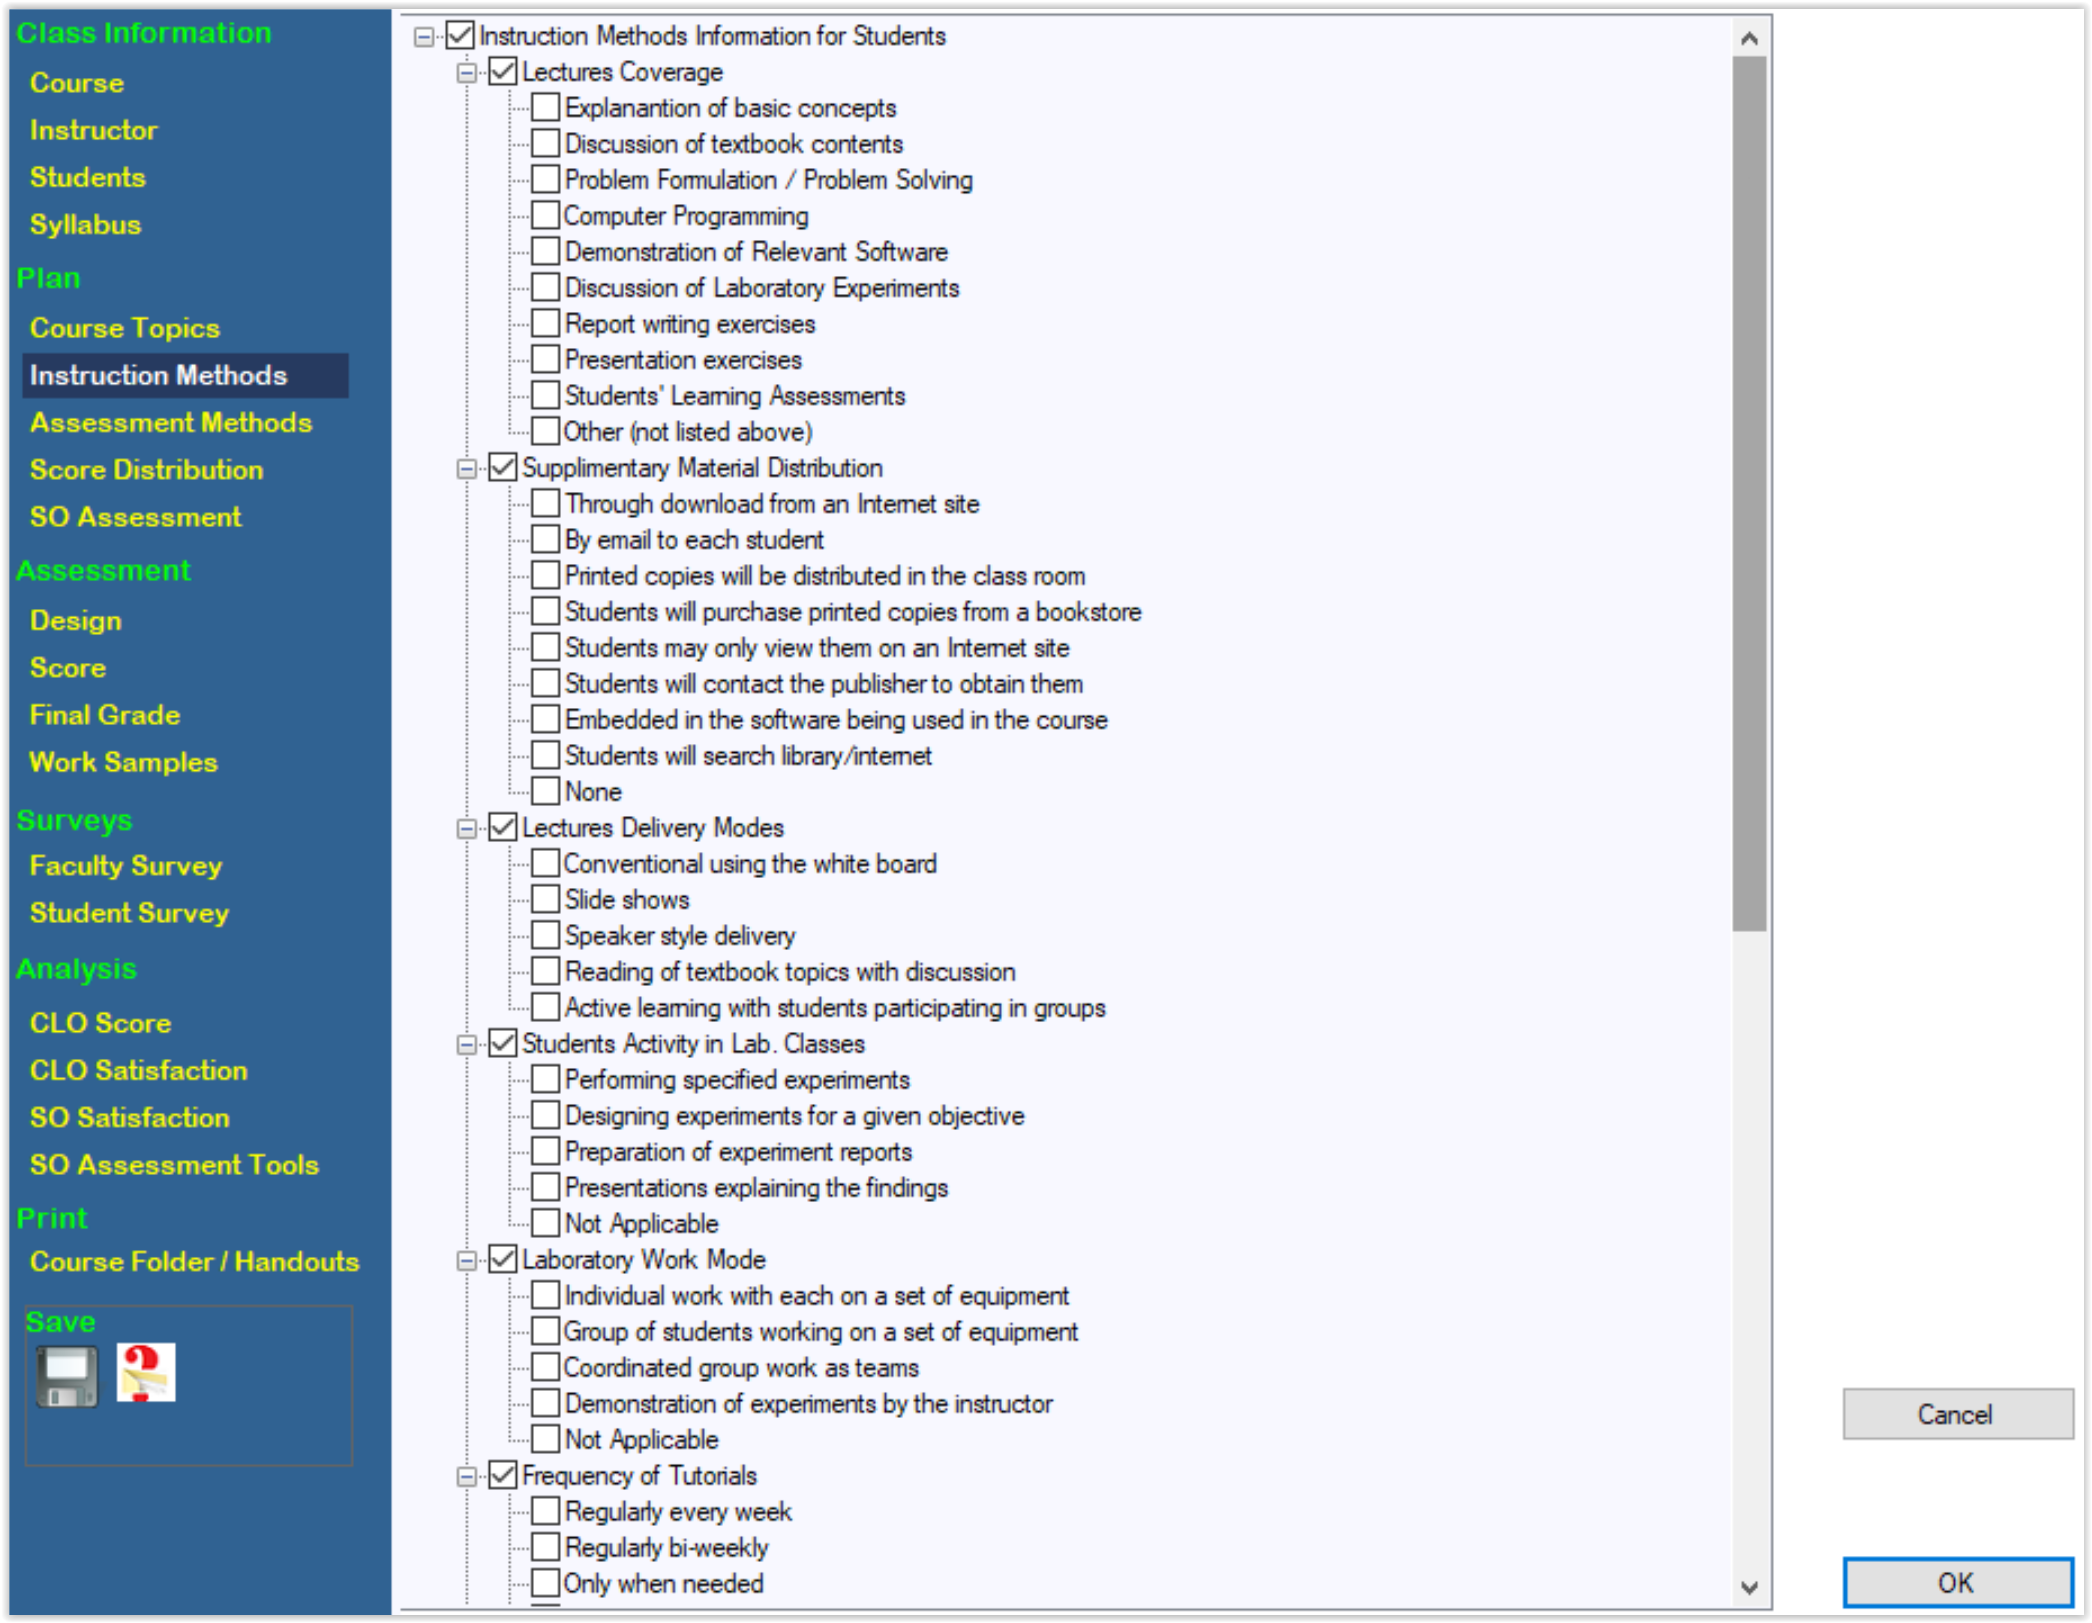
5.2 Instruction
Instruction page is shown in Fig. 11. The instructional methods have been divided into several categories. Each category has a few options. The instructor will check the options that are appropriate for teaching the course.
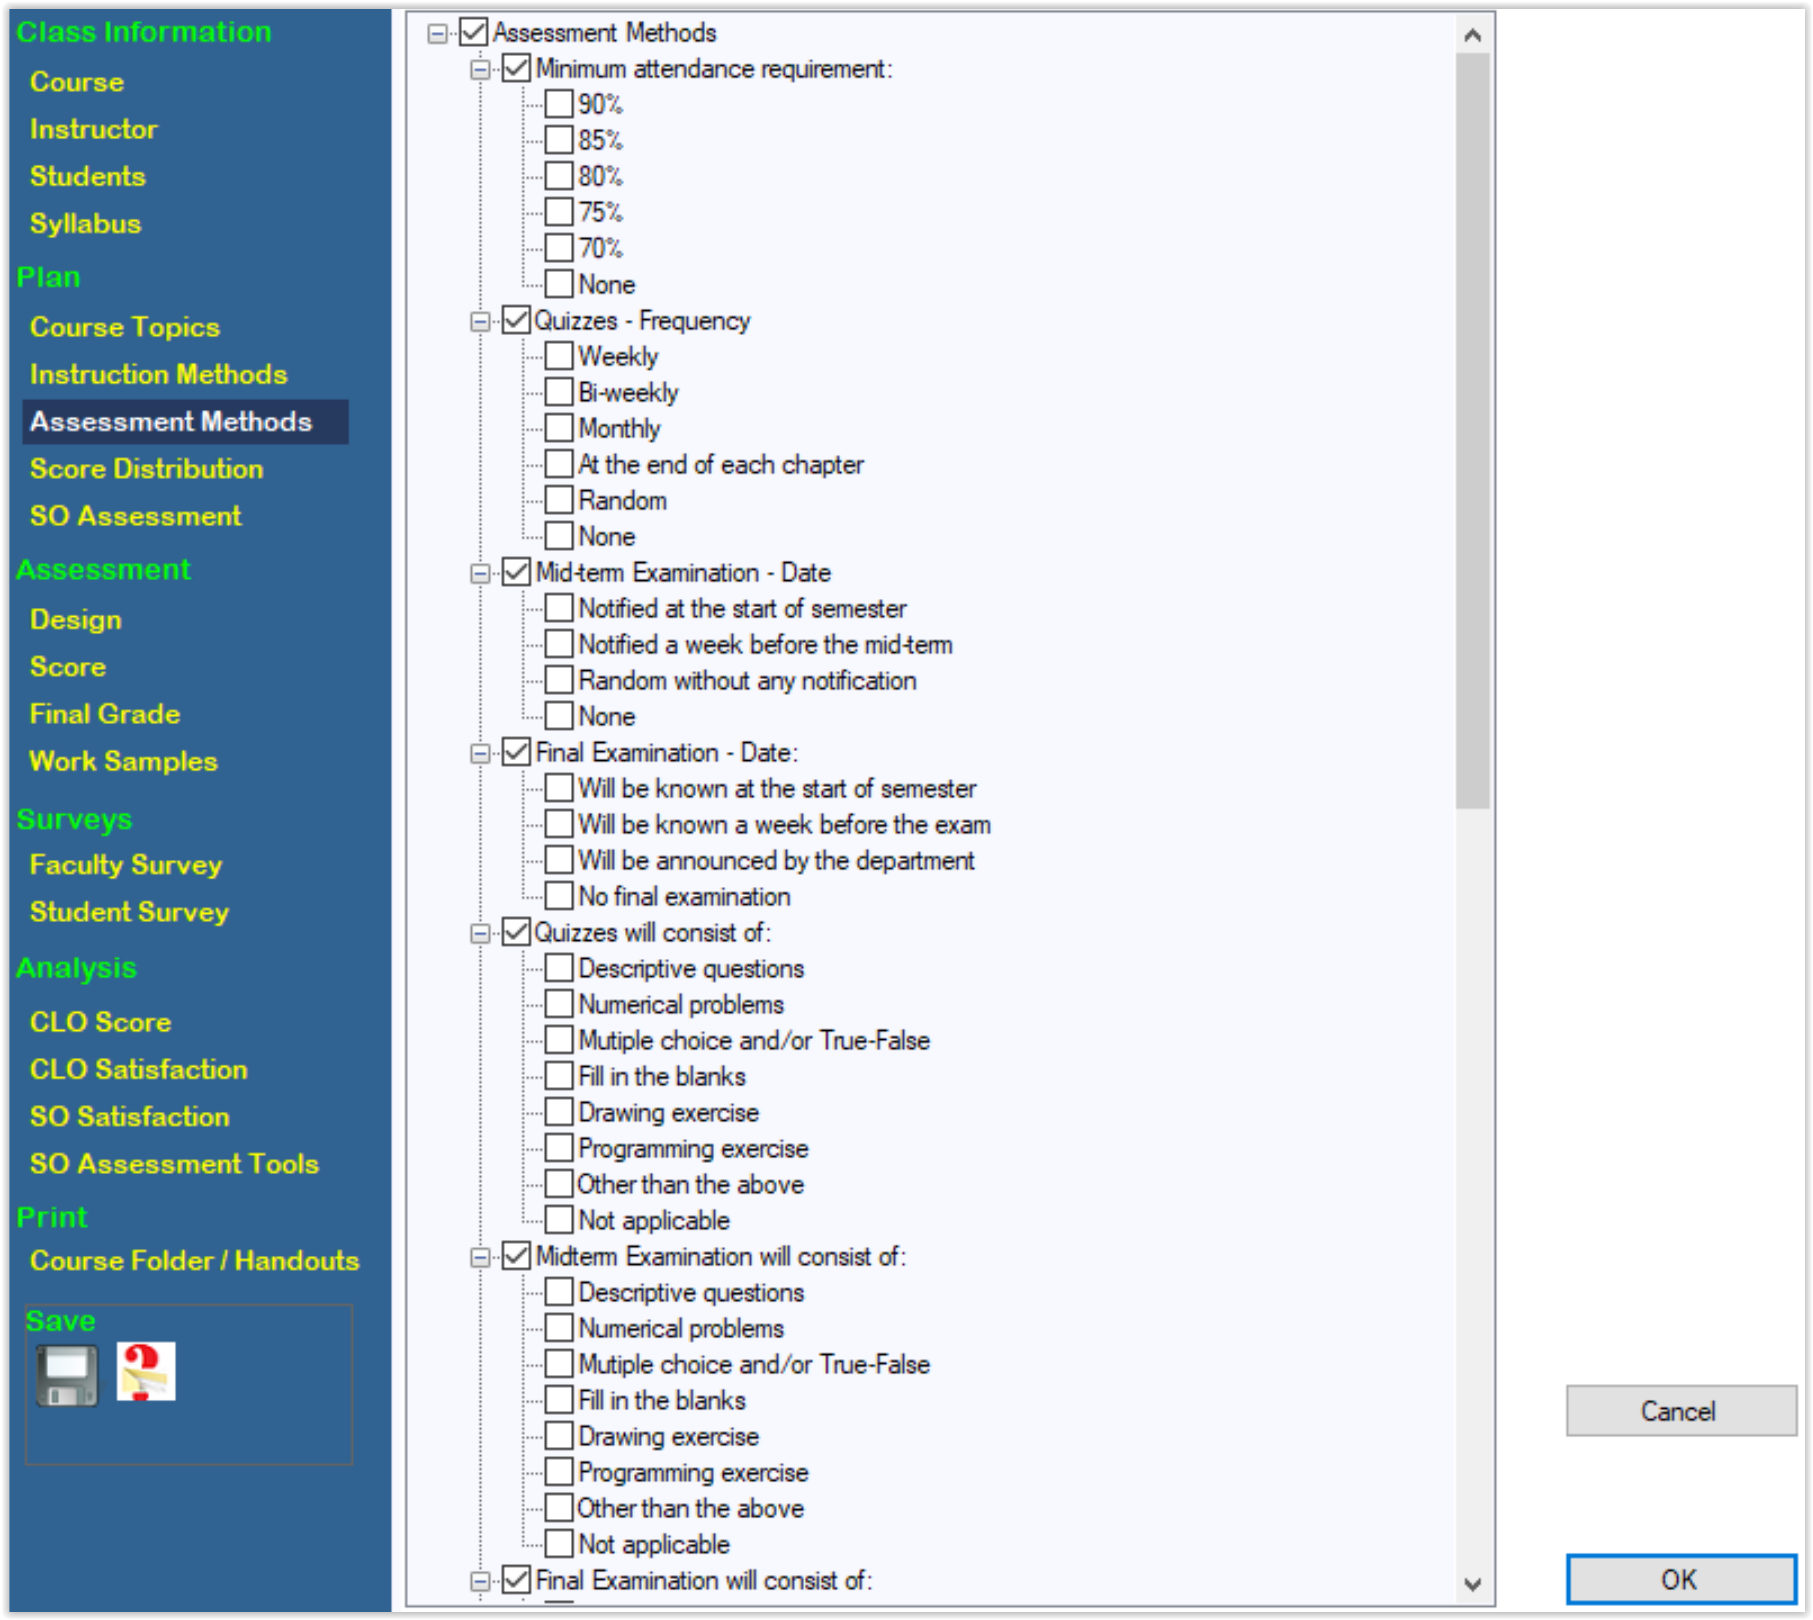
5.3 Assessment
Assessment page is shown in Fig. 12. The assessment methods have been divided into several categories. Each category has a few options. The instructor will check the options that are appropriate for teaching the course.
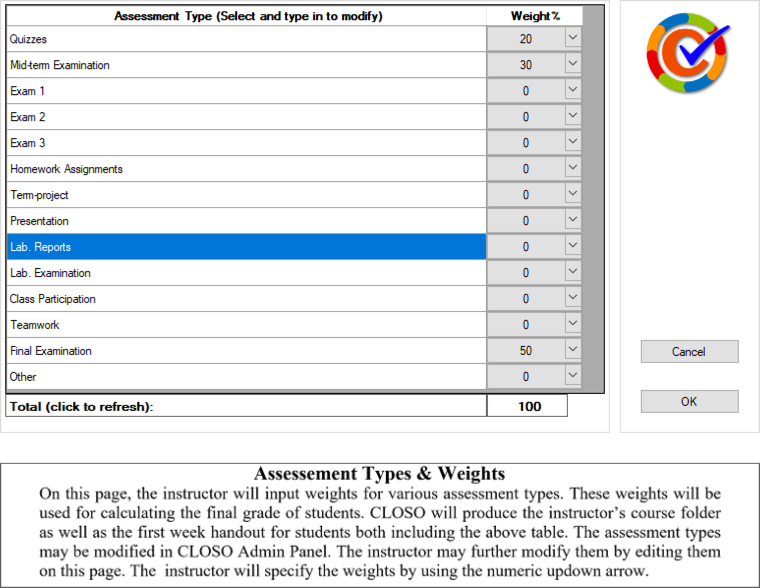
5.4 Assessment Types
Assessment Types page is shown in Fig. 13. Here, the instructor specifies the percent points allocated to various assessments that contribute towards the final grade. The instructor can type in his/her own assessment name for any of the listed assessments.
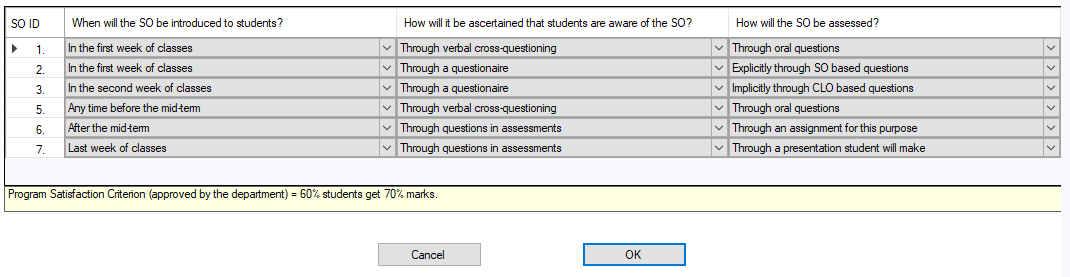
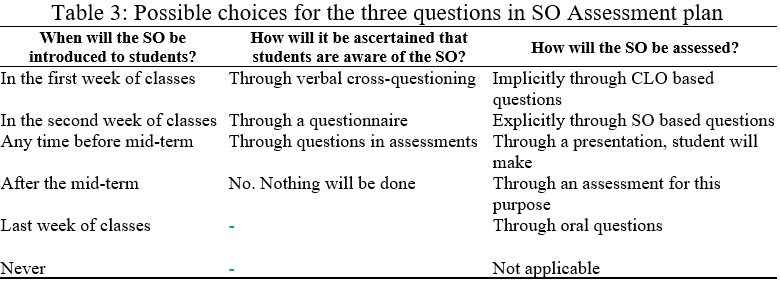
5.5 SO Introduction
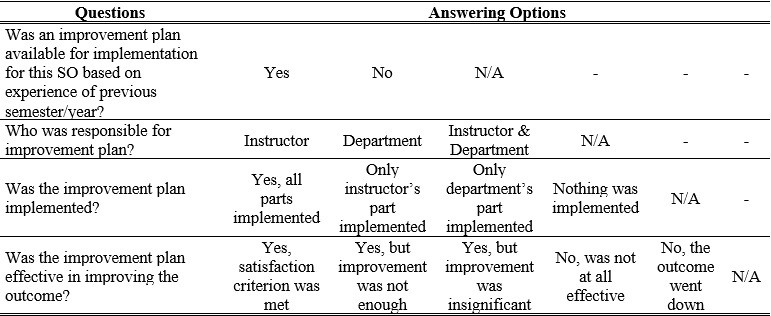
SO Introduction page is shown in Fig. 14. Here, the instructor details how the SOs relevant to the course will be introduced to students and how they will be assessed. Three simple questions are asked for each SO. The instructor selects answers to each of the questions from the dropdown list. Table 3 shows the three questions and available choices for answering them.
6 SCORE MANAGEMENT
This chapter describes the options available to the instructor for managing students’ scores in assessments and grades. CLOSO makes data entry easy. The instructors can see students’ performance in each CLO using graphic displays with bar charts. CLOSO also makes automatic adjustments to assessment scores for user-defined parameters. If the user chooses the option, the bell-shaped grade distribution can be achieved
6.1 Assessment Design
Assessment Design page is shown in Fig. 15. Entering data in this page is the first step in instructor’s score management. This page helps an instructor in designing the assessments.
In “Assessment Design”, the instructor will specify attributes of each Question Set (QS) in an assessment. A Question Set is a set of questions with the same attributes. The attributes are as follows:
- 1. CLO addressed in the question
- 2. SO addressed in the question
- 3. Bloom’s Level of the question
- 4. Maximum Raw Score for the question
- 5. Contribution of the question to the Final Grade
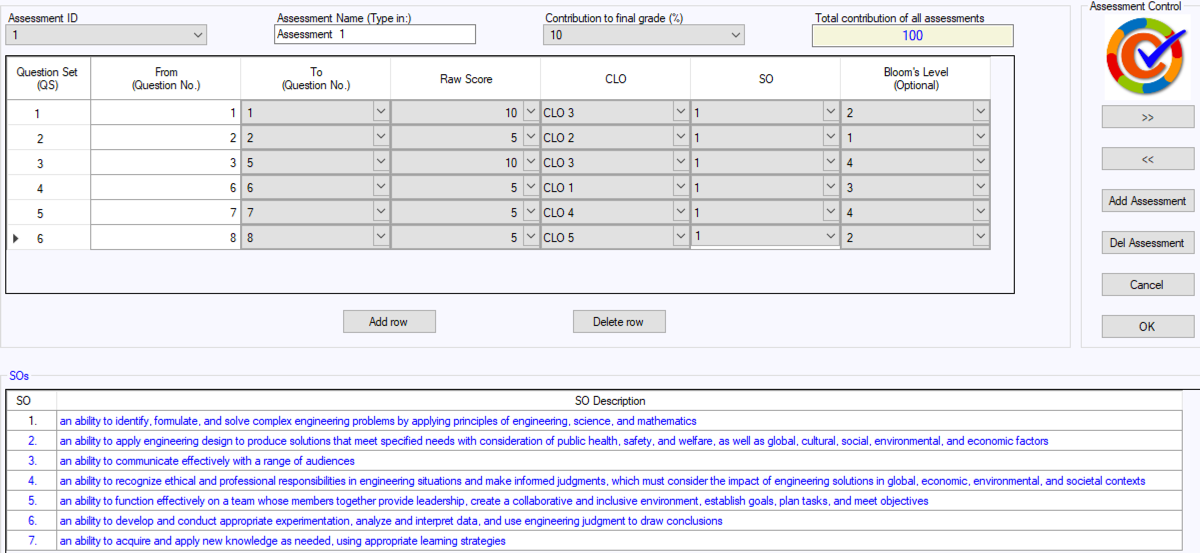
It may be noted here that the Bloom’s level for various CLOs and SOs is pre-specified for a program by the department, and the CLOSO Administrator for the department will enter them in the unified database through the CLOSO Admin Panel. As the user moves the mouse pointer from a column to another, relevant information appears at the bottom of the page.
To design another assessment, click “Add Assessment” and to delete the current assessment, click “Del Assessment”.
6.2 Score Input
Score Input page is shown in Fig. 16. It has two modes:
By default, this page opens in the “Original” marks input mode. The following information is displayed the table on the top for each question set:
- 1. Maximum Raw Marks
- 2. Contribution to Final Grade
- 3. CLO addressed in each question set
- 4. Dominant SO targeted in each question set
- 5. Bloom’s Taxonomy Level of each question set
At the bottom of the page, the following controls are provided:
- 1. Input mode selector
- 2. Assessment selection control
- 3. Contribution to final grade display (check/uncheck)
- 4. Percentage display (check/uncheck)
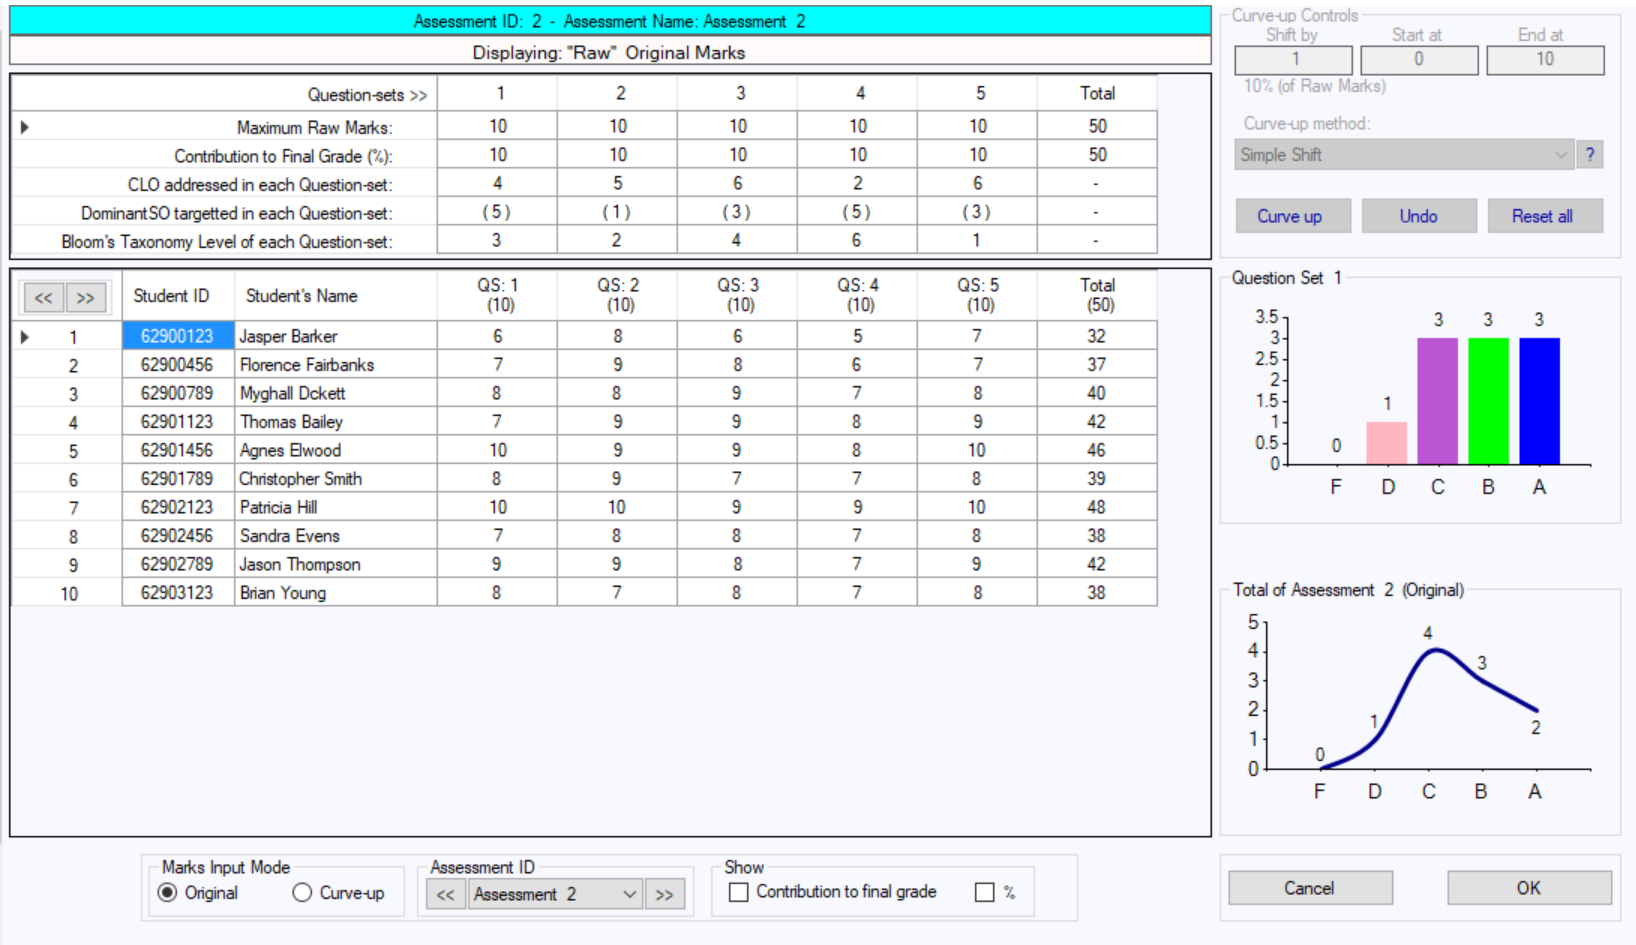
Score Input mode is for entering raw scores and the Curve-up mode allows the user to enter curve-up parameters. The “Curve-up Controls” on the top right of the window are enabled only if the “Curve-up” input mode is selected. The following graphical displays on the right side of the page are available:
- a) Students’ performance for a selected question set
- b) Students’ performance for the whole assessment
Assessment Data Input
A table is displayed in the lower half of the page for assessment data input. Students’ ID and Names will appear in the first two columns (this is if the instructor has already entered them in “Students” page). The scores can be entered manually for each student or by “Copy-Paste” from EXCEL or other applications. Copy and paste from EXCEL or any other application may be done cell-to- cell, column-to-column or multiple columns to multiple columns. Select the relevant cells in Score input table, right-mouse click, and then choose “Paste”. The data will be copied.
If all the columns of the table for entering student scores do not fit on the screen, clicking button
 in the top left cell of the table will
increase the width of the table. To squeeze back,
in the top left cell of the table will
increase the width of the table. To squeeze back, click button.
Bar Chart
The bar chart gives a visual summary of students’ performance. It shows the number of students in each grade for a given question set in each assessment. The user can navigate through the assessments as well as question sets to see student performance. A bar chart will be shown for the question set that has been selected in the score input table. If the user selects the column “Total”, the bar chart displays grades based upon the total.
Curve-up Mode
When the user selects the “Curve-up” input mode, the page shown in Fig. 17 will appear. Curve-up controls, disabled in Score Input mode, are now enabled. Here, a question arises about why a curve-up option is needed. The answer is simple. Often times, the students’ raw scores don’t represent the true picture of their real abilities for the required learning outcomes. The reasons may be one or more of the following:
- • Non-uniformity of grading standards from instructor to instructor
- • Questions asked were too hard
- • Assessment was graded too harshly
- • Other reasons
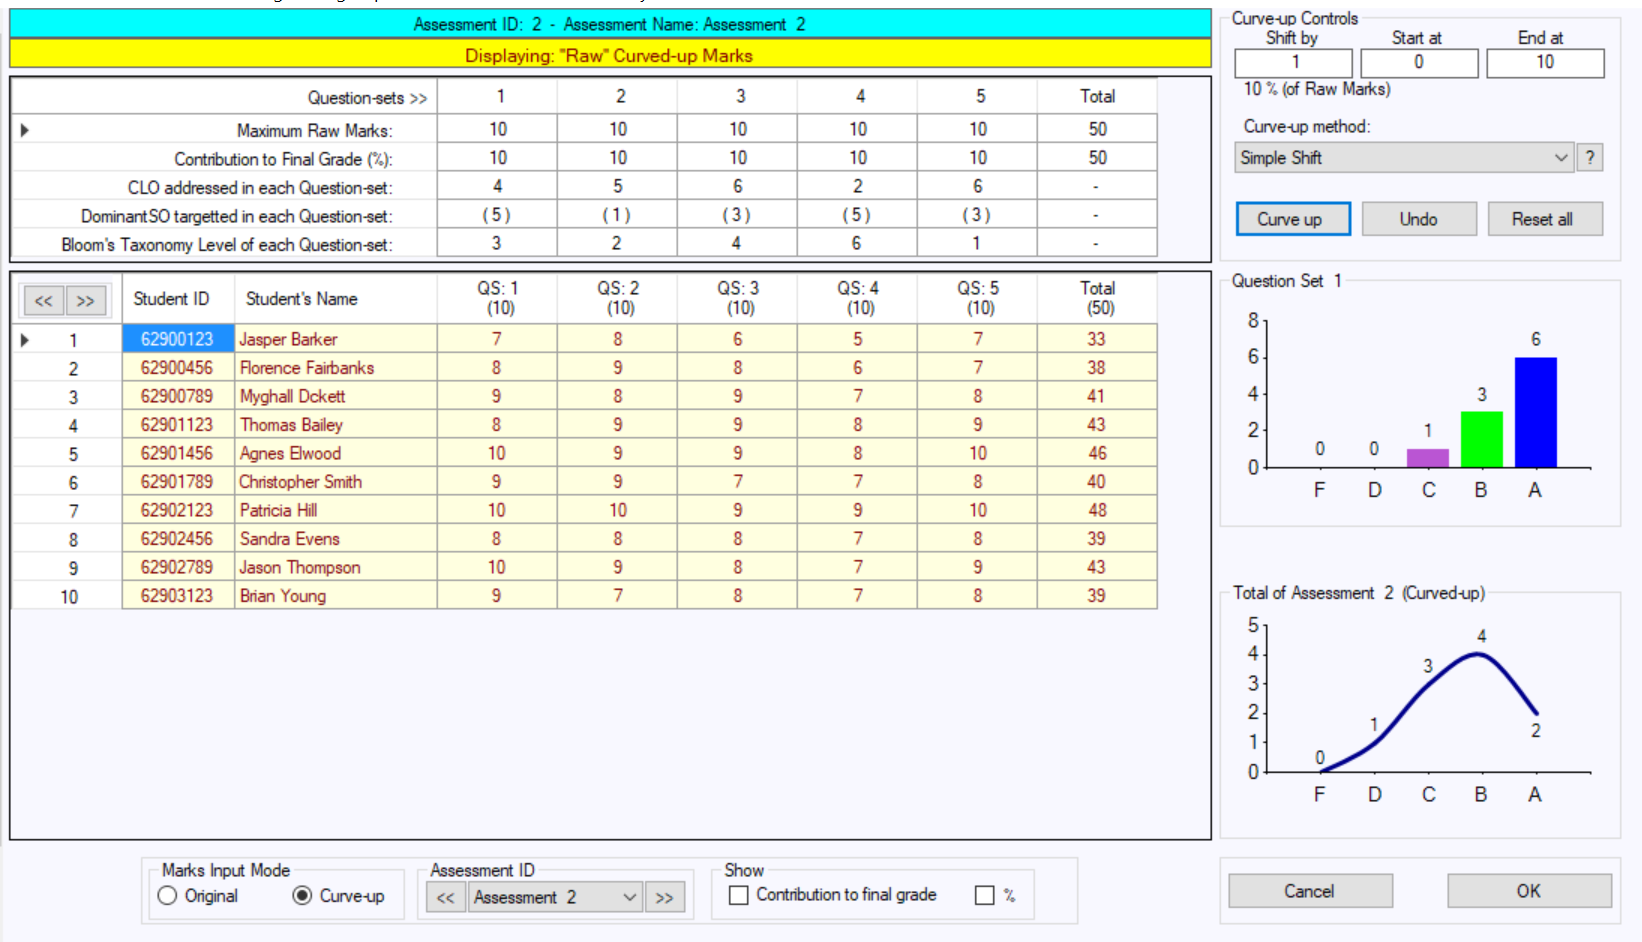
In such cases, the instructor may decide to curve-up. This is a common practice, and most universities throughout the world engage in curve-up to best represent students’ abilities. There are five curve-up options. An option can be chosen using the “Curve-up method” dropdown menu in “Curve-up Controls”. These options are:
- (1) Simple Shift
- (2) Top Tilt
- (3) Top Tilt & Round off
- (4) Bottom Tilt
- (5) Bottom Tilt & Round off
A pictorial explanation of these options is shown in Fig. 18. The instructor selects a curve-up method using the drop-down list and then enters the parameters Shift by, Start at and End at. Shift by specifies the amount by which the scores are to be shifted up. Start at and End at specify the range of scores on which the curve-up method is to be applied. For example, let’s say an instructor wants to leave out students with extremely low scores. In such a case, the instructor can specify a lower limit on the scores using Start at so that students who achieved scores less than the Start at score do not get any curve-up. Next, the instructor chooses the Assessment and the Question Set to apply the curve-up on. Finally, the instructor will click the “Curve up” button to produce the required curved-up scores.
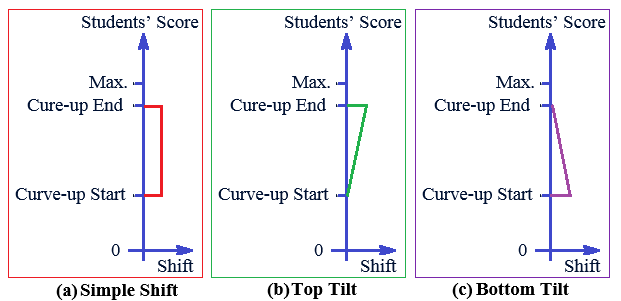
Simple Shift
This is the simplest curve-up option where the scores of students in a given range are moved up by a constant value specified in the text box labeled “Shift by”. The range is specified by entering the desired values in the “Start at” and “End at” text boxes. When the instructor presses the “Curve up” button, scores of students falling in the specified range are shifted up by the constant value specified in the “Shift by” box.
Top Tilt
As shown in Fig. 18, the “Top Tilt” method gives more credit to students with higher scores than students with lower scores. The value specified in Shift by is proportionally distributed to the students with scores within the specified range. CLOSO ensures that, after shifting up, the scores do not cross the maximum score.
Bottom Tilt
As opposed to “Top Tilt” method, “Bottom Tilt” gives more credit to the students with lower scores than the students with higher scores.
6.3 Final Grade
“Final Grade” page is as shown in Fig. 19. The table shows student IDs and names in the first two columns and Raw Score, Curved-up Score and Final Grades in the final three columns. The right side of Fig. 19 shows the distribution of grades in graphical format. Three plots for final grades are shown. The top plot is for raw scores, the middle plot is for curved-up scores and the last plot is for Bell-shaped normalized scores.
Normalization of Grades to Bell-shape
Adjustments and fine-tuning are almost always needed before finalizing the student grades. It is a common practice to normalize the final grades of students and bring them to a bell shape distribution.
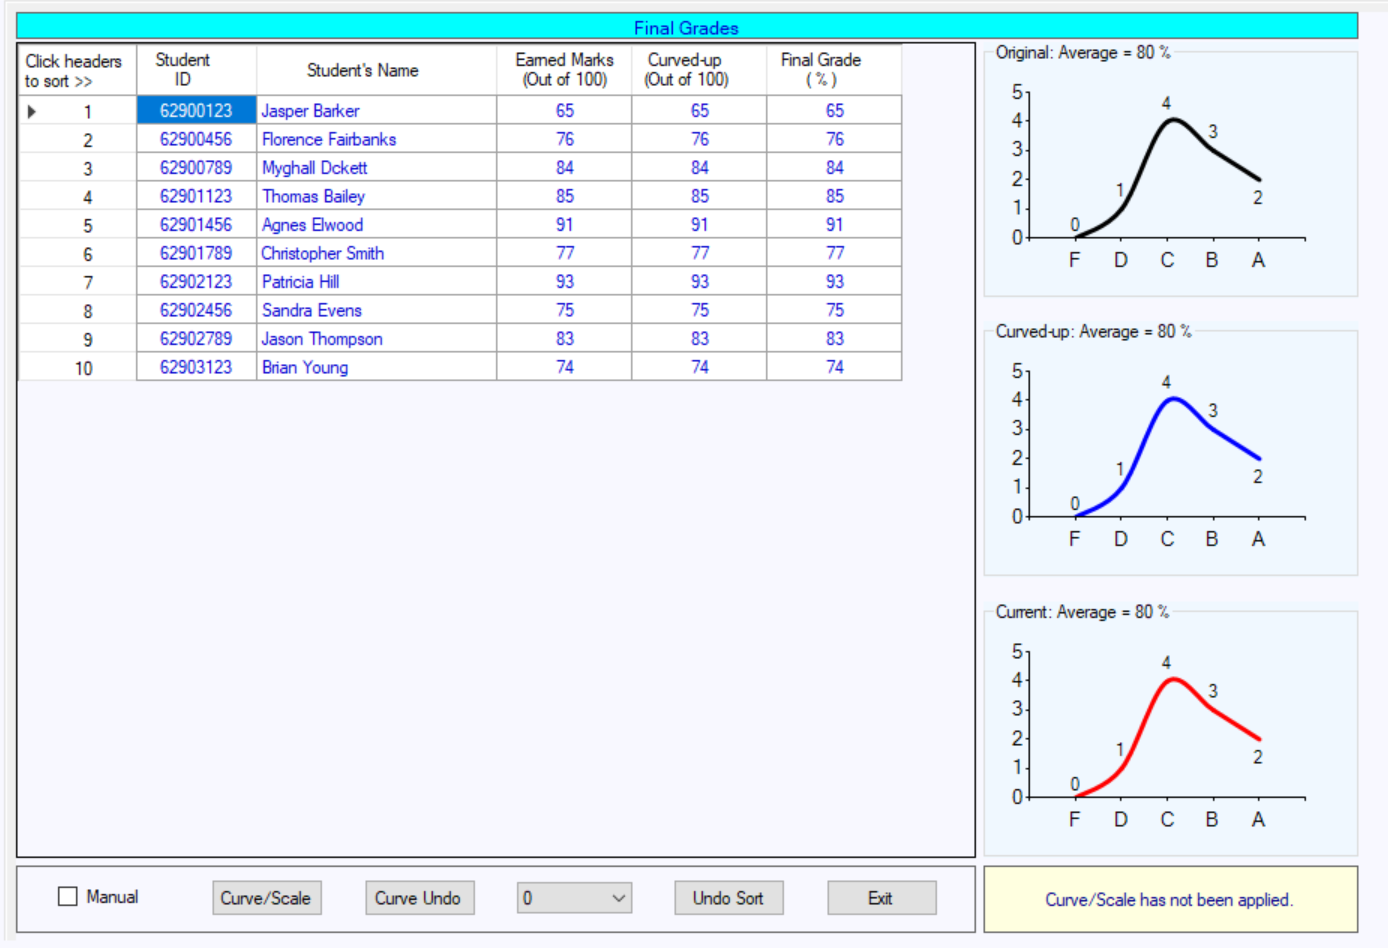
To use this feature, click the “Curve/Scale” button. A window as shown in Fig. 20 appears. Desired percentage of students in grades A, B, D and F are specified by the instructor. In case the percentages specified are inappropriate for bell shape distribution, the software displays a message as shown in Fig. 21.
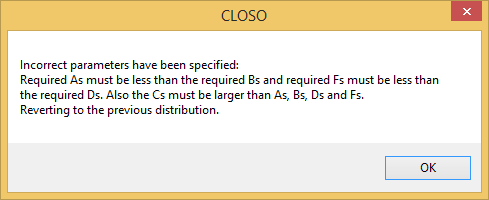
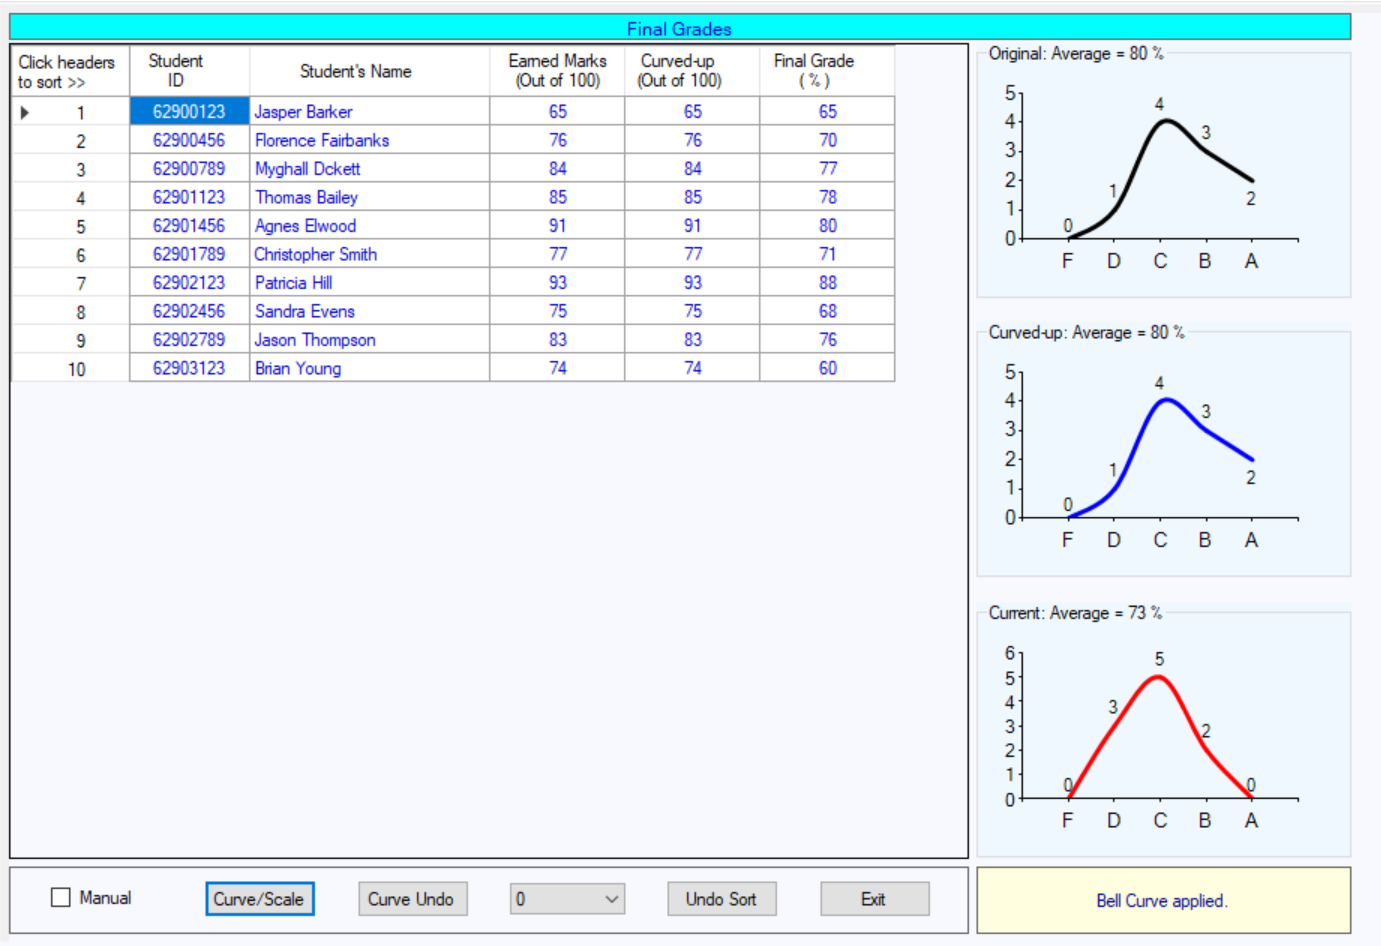
Fig. 22 shows the results of the bell shape operation. In doing so, it does not alter the relative standing of students in the class

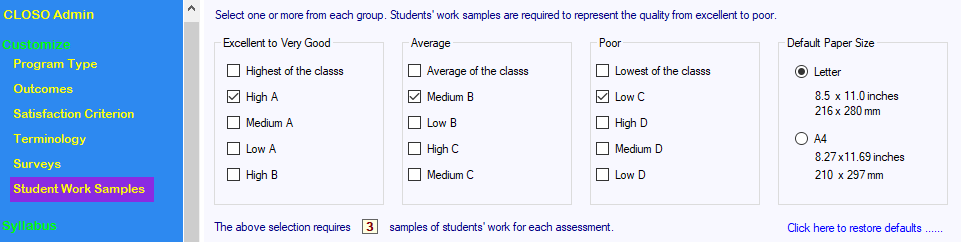
7 WORK SAMPLES
Providing students’ work samples is a necessary requirement of ABET and other accreditation agencies. CLOSO integrates them automatically in the course folder. Students’ work samples for each assessment include the question paper for the assessment, correct answer yielding a 100% score, and samples of students’ answer sheets ranging from high to low grades. Based on the recommendations of the department, the CLOSO Administrator will specify the required types of work samples using the CLOSO Admin Panel. The instructor will then include these types of student work samples while preparing the course folder using CLOSO. This chapter describes how to do this.
Scanned images of students’ work samples are loaded into CLOSO through two options: 1) using one or more PDF files or 2) using image files where each file contains one scanned image. These are described as follows:
7.1 Loading Scanned Images Using PDF
To use this option, Adobe Acrobat Professional is required to have been preinstalled and involves the following steps:- 1. Collect all student work samples including the questions, correct answer for a 100% score and samples of students’ answers.
- 2. Print cover sheets from CLOSO “Course Folder/Handouts” page as is described in Chapter 10.
- 3. Organize the sheets so that each cover page is before the relevant work sample.
- 4. Scan all the work samples with the cover sheets to produce a PDF file. Save the PDF file in a folder of your choice.
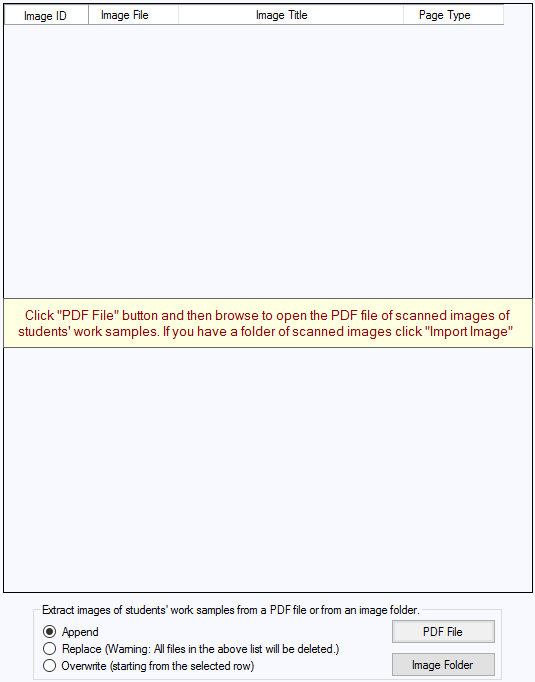
- 5. Open the CLOSO input file for the course and click “Work Samples” in the left panel menu. The “Work Samples” page is shown in Fig. 23.
- 6. Click “PDF File” button. The file browser will open. Browse to the PDF file containing the scanned images and click OK.
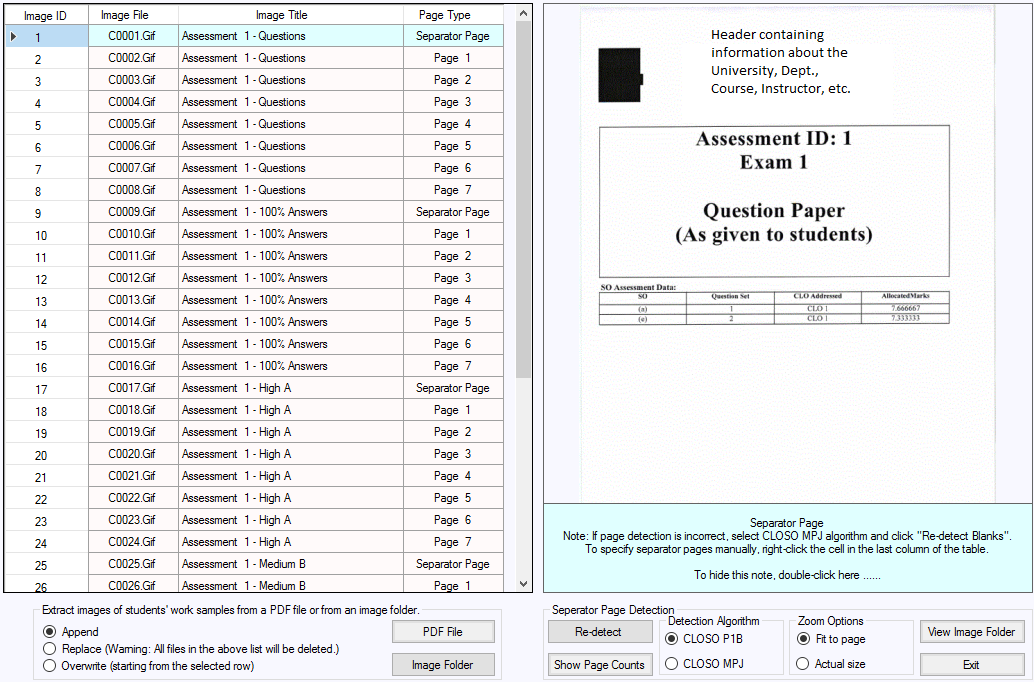
- 7. Names of all image files found in the folder are displayed as shown in Fig. 24.
- 8. When the option “Append” (shown at the bottom of Fig. 23) is selected, the existing images are not overwritten. Scanned images are appended to the existing images. The “Overwrite” option, when selected, the images extracted from the PDF overwrite the previously extracted images starting from the selected row.
7.2 Viewing Scanned Images
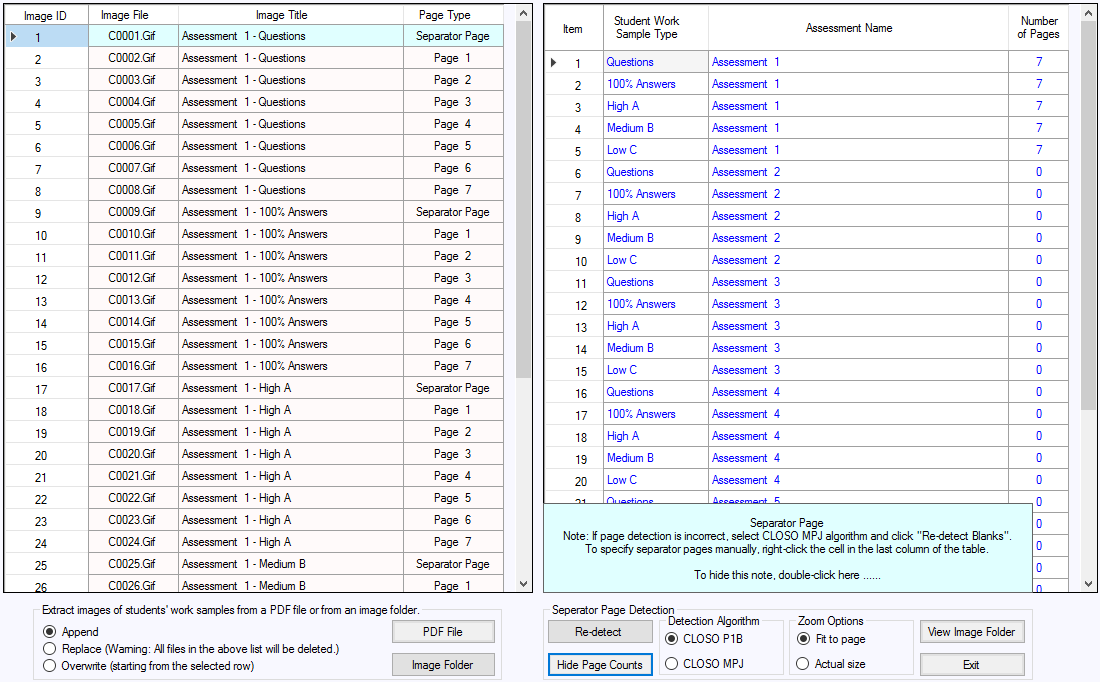
Fig. 24 shows four columns in the table that display the list of image files. These columns contain the following data:
-
1. Image ID: A number indicating the position of the image in the samples
2. Image File: File name of each page.
3. Image Title: Assessment name as specified by the instructor.
4. Page Type: This column indicates whether the image file is a separator page or a work sample page.
CLOSO automatically detects cover pages. As shown in Fig. 24, CLOSO puts all the samples in order using the cover pages. However, the user must
check the data and make sure the automatic detection of cover pages has worked correctly. If CLOSO was unable to identify a cover page, the user
can correct it by making a right mouse click on the row showing the erroneously detected page. Right-click works as a toggle switch and converts
a cover page to a normal page and vice versa.
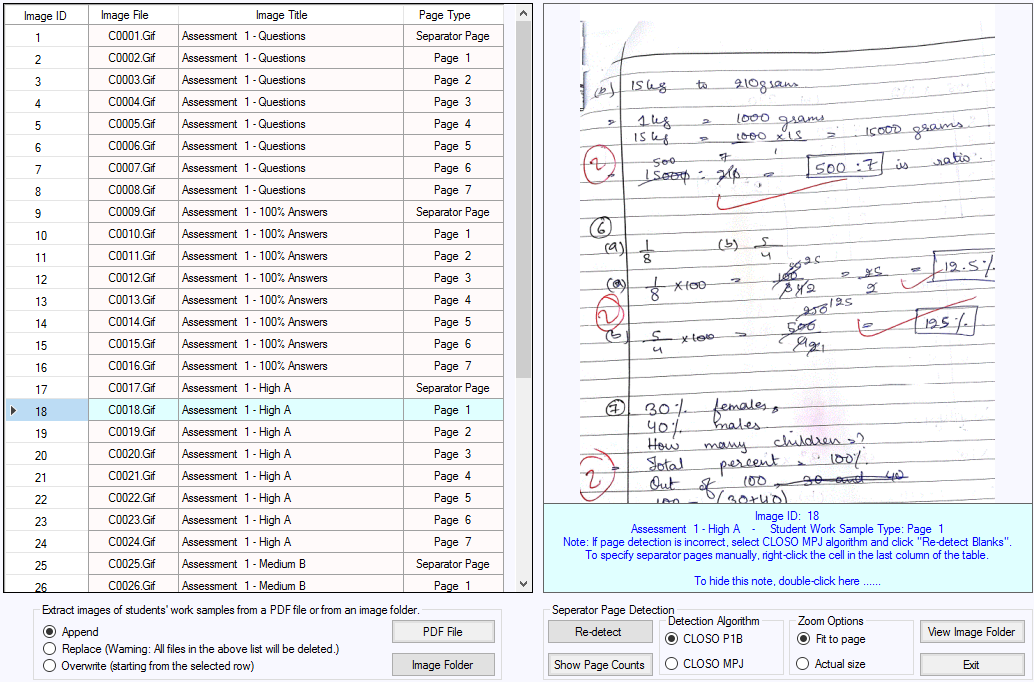
The image file of the selected row will be displayed on the right of the table as shown in Fig. 25. A row can be selected by clicking the row or by
up-down keys. The user may choose a zoom option as well (Fit to Page, Actual Size).
8 SURVEYS
Student Survey and Faculty Survey data can be input and analyzed using “Surveys” and “Analysis” pages. The student survey displays the students’ opinions about their own perception of learning. Through the Faculty Survey pages, the instructors can express their opinions on several aspects related to the students abilities, facilities, methods to improve student learning, identification of weakness and problems, etc. These surveys are described in detail in the following.
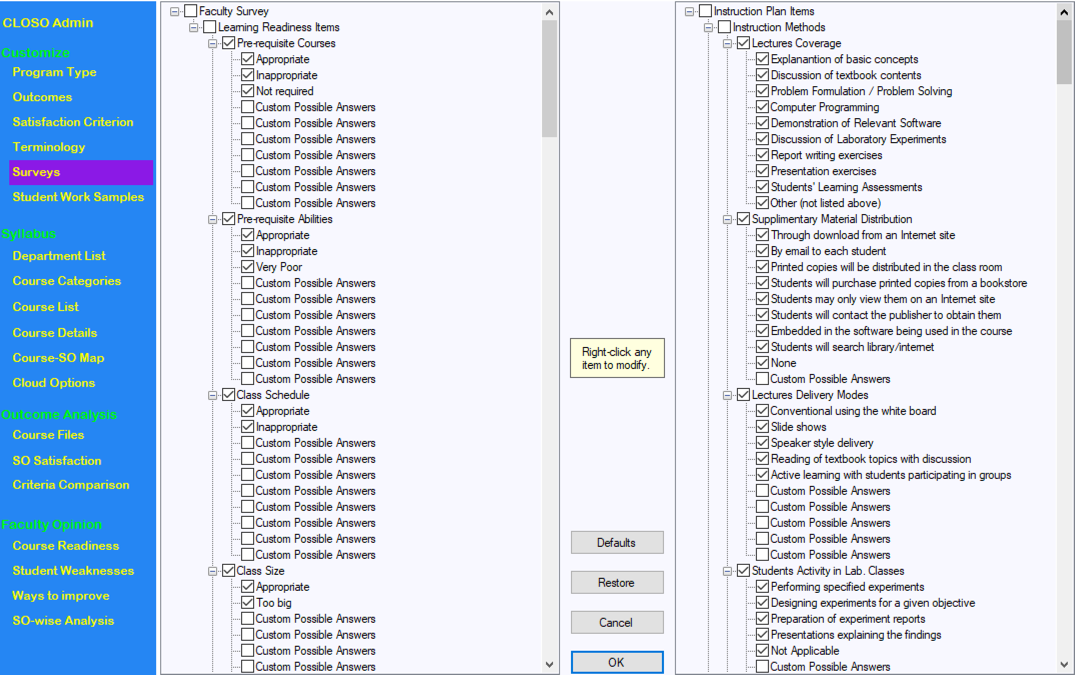
8.1 Faculty Survey
Faculty survey has six different categories as shown in Fig. 27. These are as follows:
- 1) Learning Readiness
- 2) Syllabus Coverage
- 3) CLO Satisfaction
- 4) Weaknesses
- 5) Improvement Methods
- 6) SO Loop Closing
Each of these are described in the following.
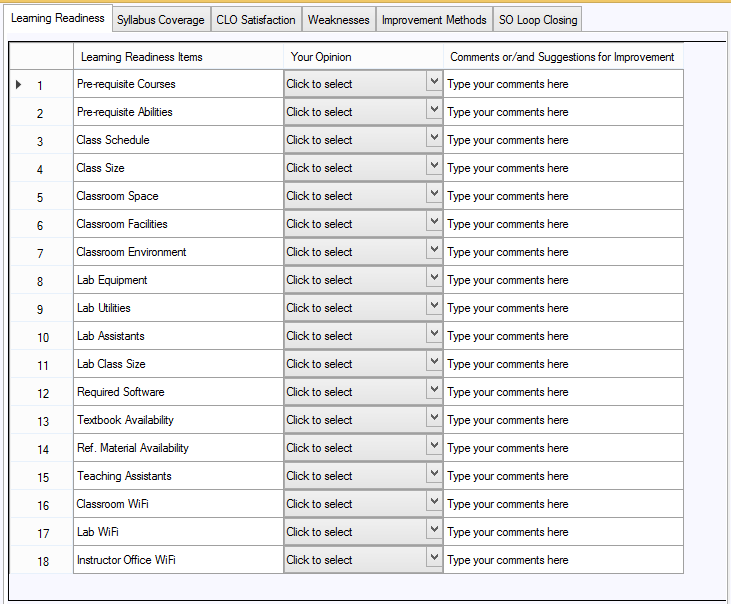
Learning Readiness
This tab allows the instructor to input feedback on basic requirements of teaching a course, such as prerequisite courses, classroom facilities and provision of teaching assistants. In order to save an instructor’s valuable time, data entry has been made easy by providing drop-down menus for each item. The instructor can choose the appropriate option for each issue by choosing an item from the drop-down menu.
An instructor can also give comments and/or suggestions for improvement in the last column of the table. Furthermore, when the mouse pointer is hovered over an issue, its explanation appears in the small yellow colored area beneath the table.
Syllabus Coverage
Fig. 28 shows typical syllabus coverage data. Course topics are displayed in the second column. The instructor’s opinion about the preparation of students in each topic is displayed in the third column where the instructor may choose “Adequate” or “Inadequate”. In case the topic was not taught for some reason, the instructor chooses “Not taught”. In the last column, the instructor enters the name of the assessment that covered the corresponding topic. If a particular topic was assessed in two or more assessments, the instructor may specify the name of the assessment with the maximum weight for that topic.
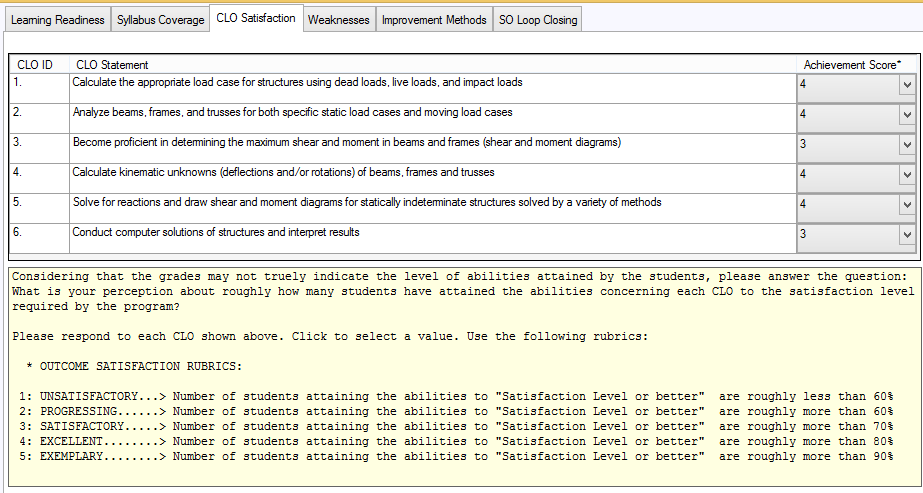
CLO Satisfaction
This page gathers the instructor’s opinion of the attainment of CLOs by the students. The CLO statements from the syllabus are displayed in the second column as shown in Fig. 29. The instructor selects an achievement score from the drop-down list in the third column to grade the students’ attainment of the abilities on a scale of 1 to 5.
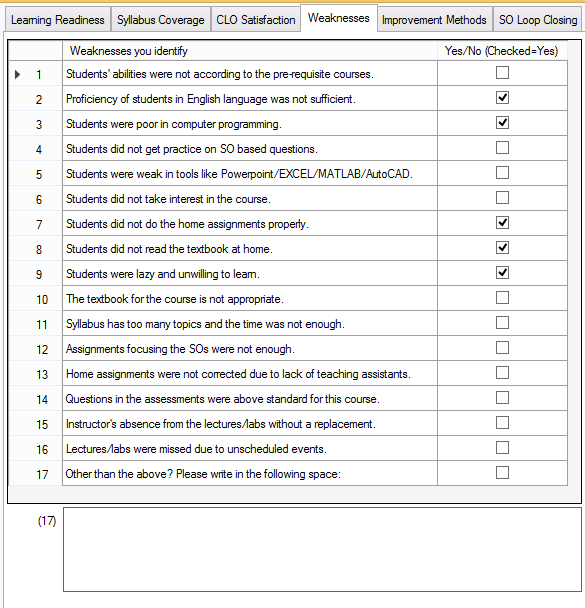
Weaknesses
Fig. 30 shows the Weaknesses tab of the faculty survey. There are 17 items on this page, along with a checkbox. If checked, it indicates a Yes; otherwise, it is a No.
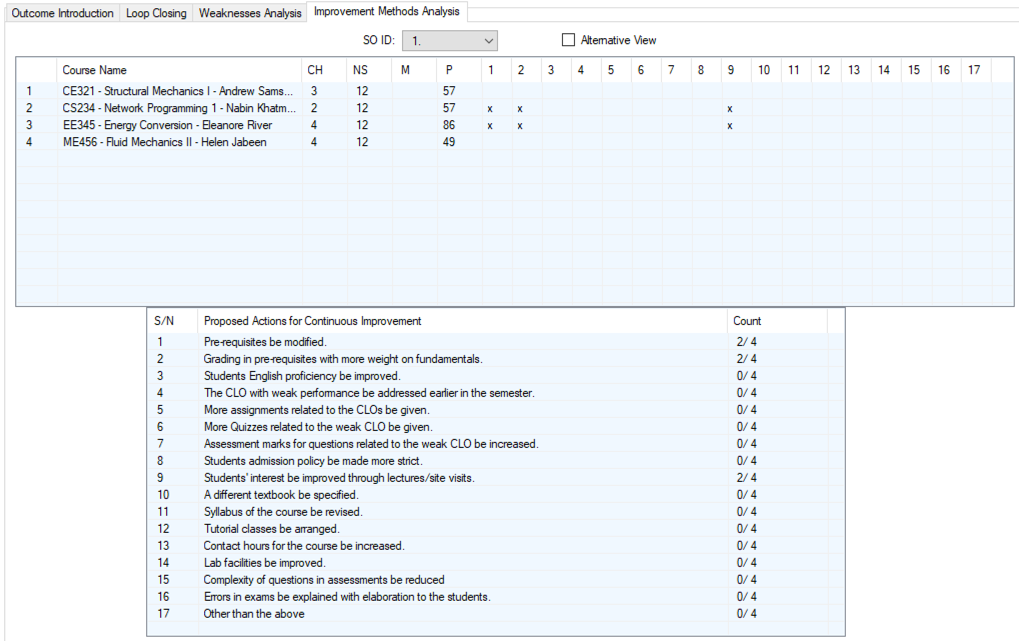
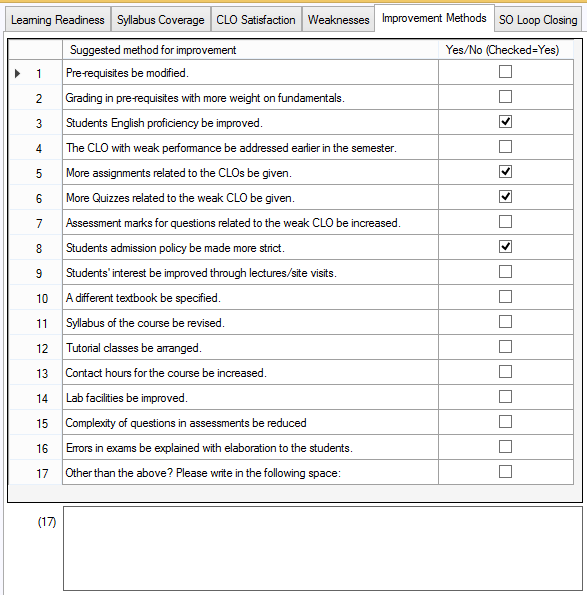
Improvement Methods
The Improvement Methods tab is shown in Fig. 31. There are 17 items, each accompanied by a checkbox. An instructor simply checks the appropriate checkboxes to recommend an improvement that would improve students’ learning.
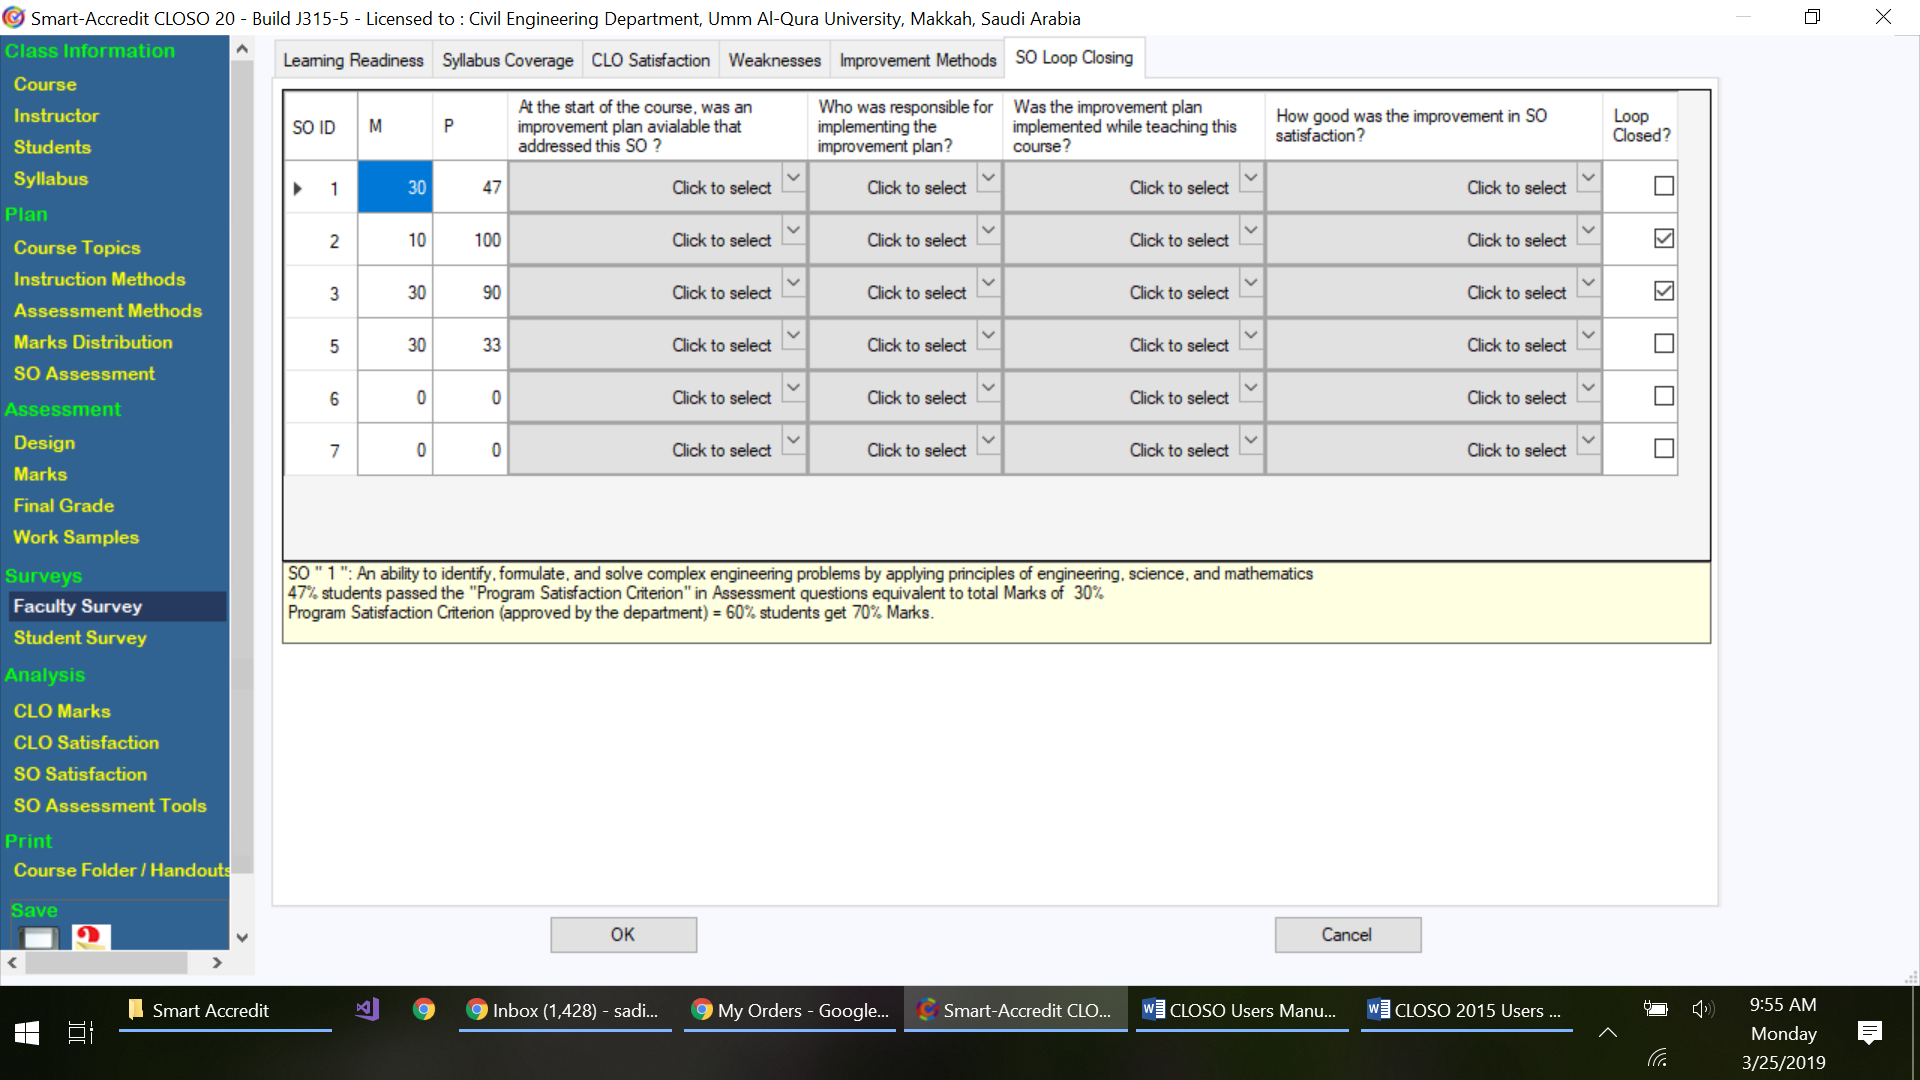
SO Loop Closing
Loop closing is the most important part of continuous improvement. An improvement cycle in an academic program is said to have closed the loop if its plan consists of the following steps:
- 1. gather evidence through direct and indirect assessments
- 2. analyze evidence for attainment of SOs
- 3. prepare an improvement plan and implement
- 4. gather evidence if the improvement plan has been effective
- 5. go back to step 1
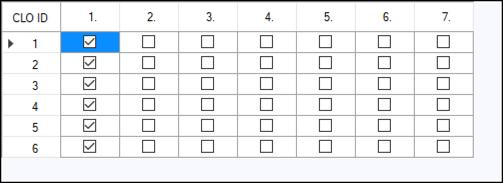
The SO Loop Closing page is shown in Fig. 32. SOs covered by the course are listed in the first column under the label SO ID. The next column shows scores out of 100 that were allocated to each SO. The third column shows the percentage of students with the required level of the SO satisfaction. The subsequent four columns ask one question each for the SOs covered by the course regarding an improvement plan and loop closing. Depending upon the nature of each question, appropriate options are given in a dropdown list to help the instructor answer the question. Table 4 enlists the questions along with all possible answering choices. If the improvement plan was effective and the outcome improved to the required level of satisfaction then the relevant checkbox in the last column is shown checked.
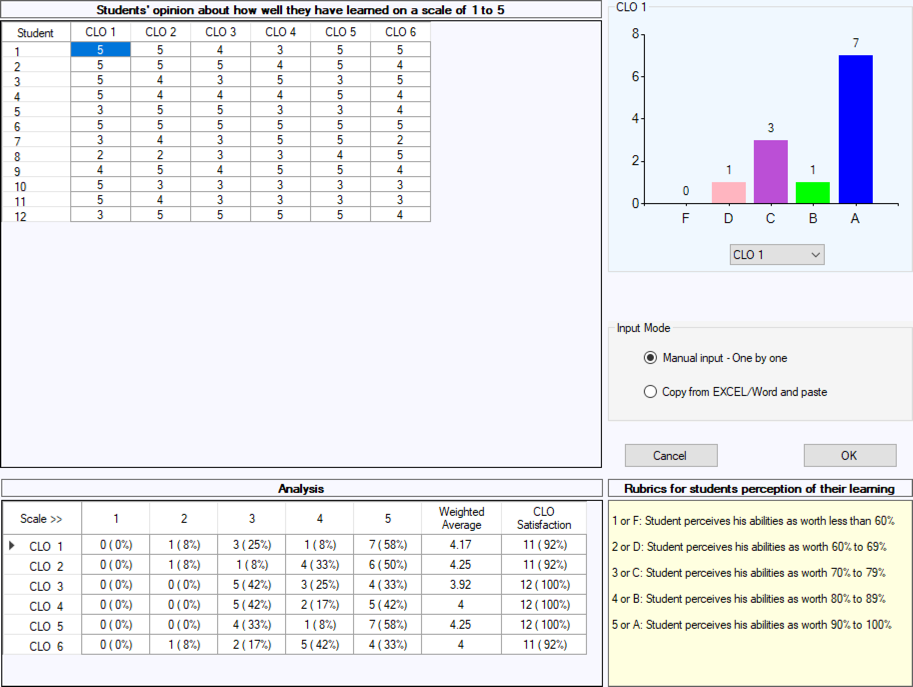
8.2 Student Survey
For each CLO, students give their perception of how well they have learned it on a scale of 1 to 5. Student responses are entered in the table shown in the top-right part of Fig. 33. The first column has student numbers and there is a column for each CLO. There are two ways to enter data:
1. Manual Input Mode: When the “Manual Input Mode” is selected, data can be entered manually by mouse clicks. Left-mouse click will increment the value by 1, while right-mouse click will decrement the value by 1. 2. Copy and Paste Mode: If the student survey data are already available in a spreadsheet or word processor, the Copy and Paste option can be used. After selecting the corresponding cells in the table, the instructor will make a right-mouse click and a menu will appear with two options: Copy and Paste. The data can be pasted in the appropriate column of the table by choosing Paste.
9 ANALYSIS
CLOSO generates CLO and SO satisfaction data. They can be viewed by clicking any of the tabs under the Analysis group in the left panel menu. These tabs (CLO Score, CLO Satisfaction, SO Satisfaction and SO Assessment Tools) are described in the following.
9.1 CLO Score
The CLO score analysis is shown in Fig. 34. It displays CLO-wise scores for each student. The table on the top has two rows. The first row gives the maximum raw score (out of 100) allocated to each CLO. The second row gives each CLO’s contribution towards the final grade. The table in the middle displays CLO-wise student scores, while the table at the bottom displays the percentages of students passing various satisfaction criteria.
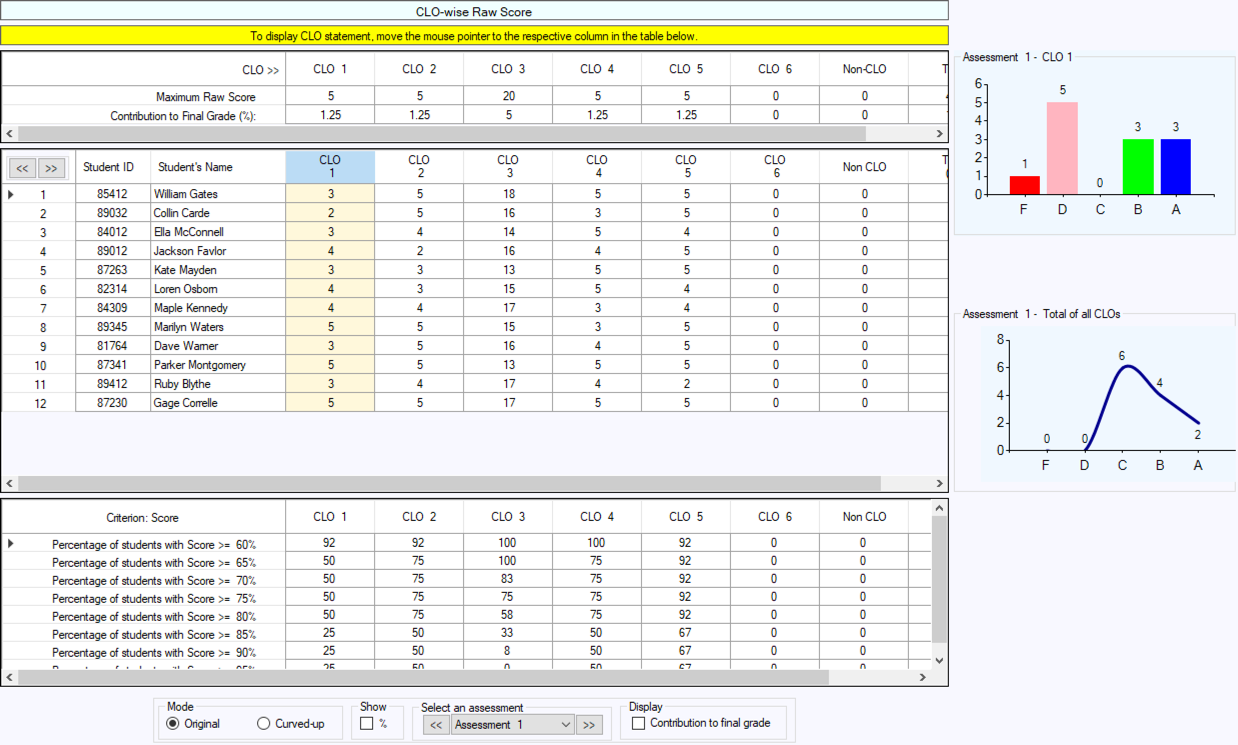
At the bottom of the page shown in Fig. 34, there are the following display/input options:
- 1. Original score input or curve-up input
- 2. Actual score or percentage score display
- 3. Assessment selection dropdown list
- 4. Contribution to final grade display
- 1. Students’ performance for the selected CLO
- 2. Students’ performance for the selected assessment including all CLOs.
On the right side of the page, the following charts are displayed:
9.2 CLO Satisfaction
The CLO Satisfaction page is shown in Fig. 35. It displays the summary of CLO satisfaction based on data from all assessments. It also shows the scores (points out of 100) allocated to a particular CLO in each assessment.
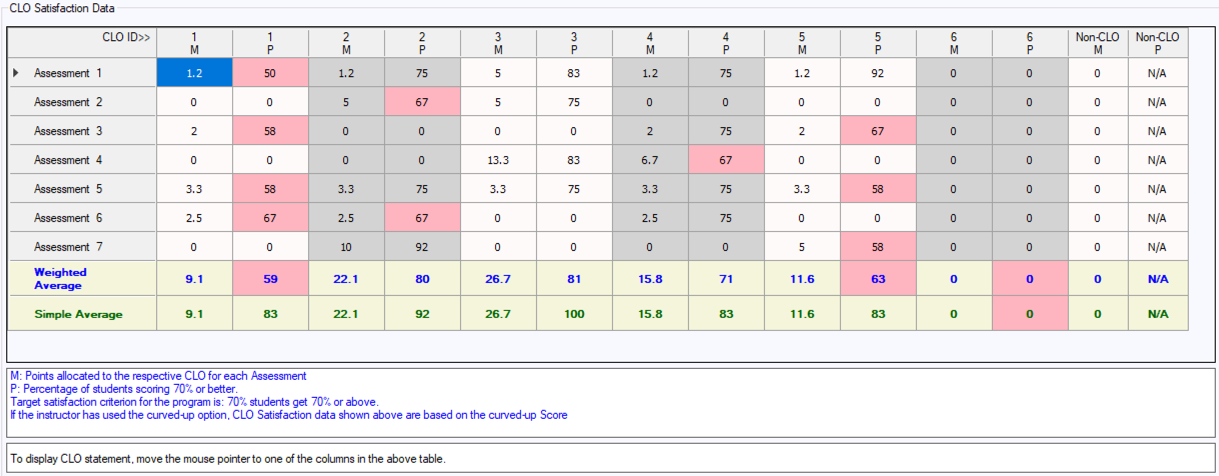
For each CLO, there are two columns labeled M and P. The column labeled M contains the score (out of 100) allocated to the CLO for a particular assessment. The column labeled P contains the percentage of students satisfying the criterion for the CLO.
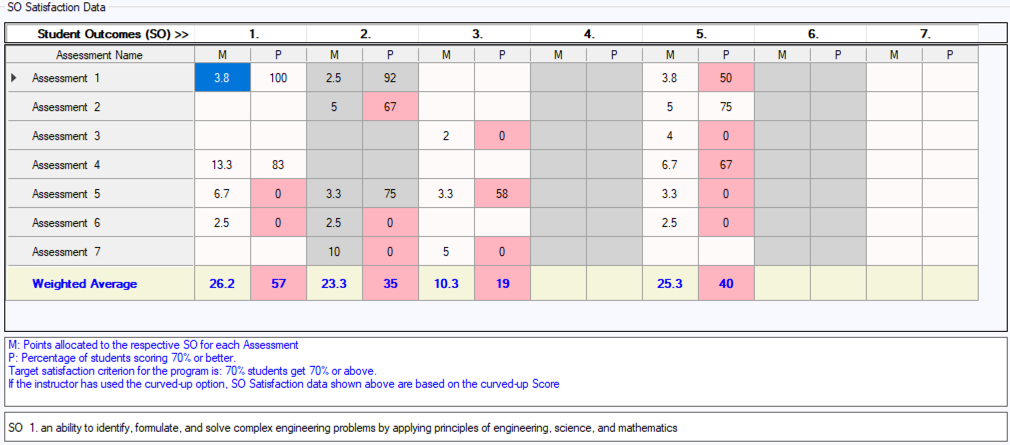
9.3 SO Satisfaction
SO Satisfaction page is shown in Fig. 36. The first column lists the names of the assessments. Each SO has two columns displaying the values of M and P. Each row, on this page, displays the scores (out of 100) associated with each SO under the header labeled M and the percentage of students attaining the program satisfaction criterion for each SO under the header labeled P. The last row displays a weighted average of the program satisfaction for each SO obtained through all the assessments.
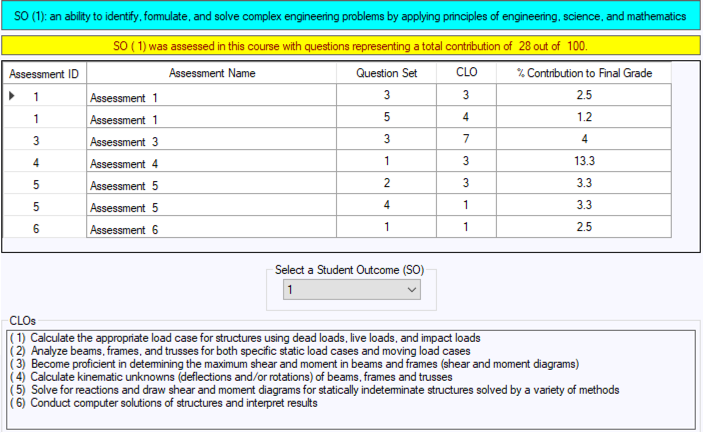
9.4 SO Tools
SO Tools are shown in Fig. 37. The text at the top displays the student outcome for which the data are being displayed . The second row displays the total score out of 100 allocated to the selected SO in the course. The table displaying the detailed information has five columns as follows:
- 1. Assessment ID
- 2. Assessment Name
- 3. Question Sets used to assess the selected SO
- 4. CLO Addressed for the selected SO
- 5. % Contribution to Final Grade
The selection box at the bottom of this table can be used to navigate through the list of SOs addressed in the course. The CLOs of the course are displayed at the bottom of the page.
10 PRINTING
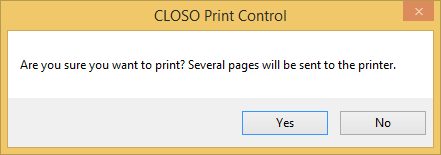
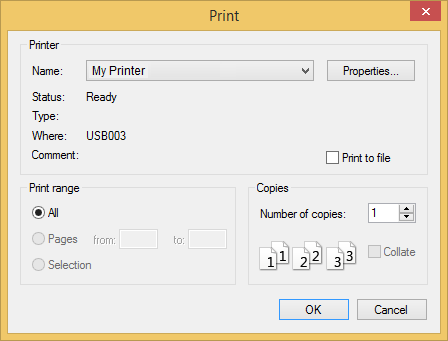
“Display Material” page is shown in Fig. 38. On this page, by clicking the “Preview” button, the user can preview the output before printing. For printing out the display material or saving as PDF file, the “Print” button has to be clicked. If there are several pages to be printed a warning as shown in Fig. 39 is displayed. If the user clicks “Yes” then the print dialog box shown in Fig. 40 appears.
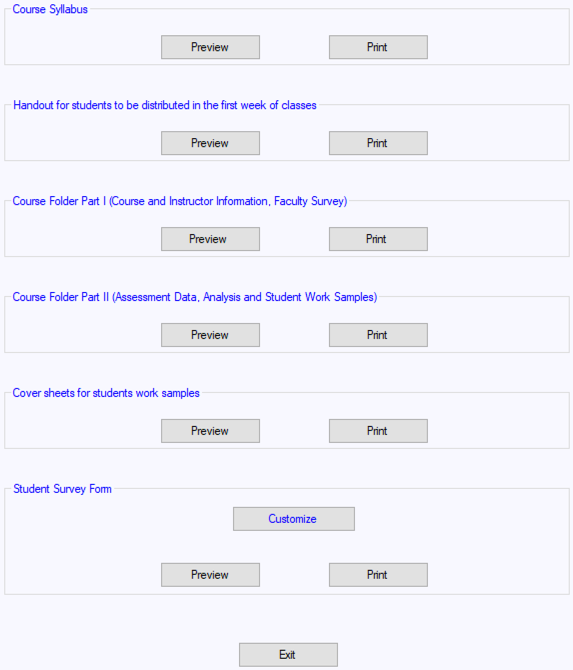
10.1 Printing Course Syllabus
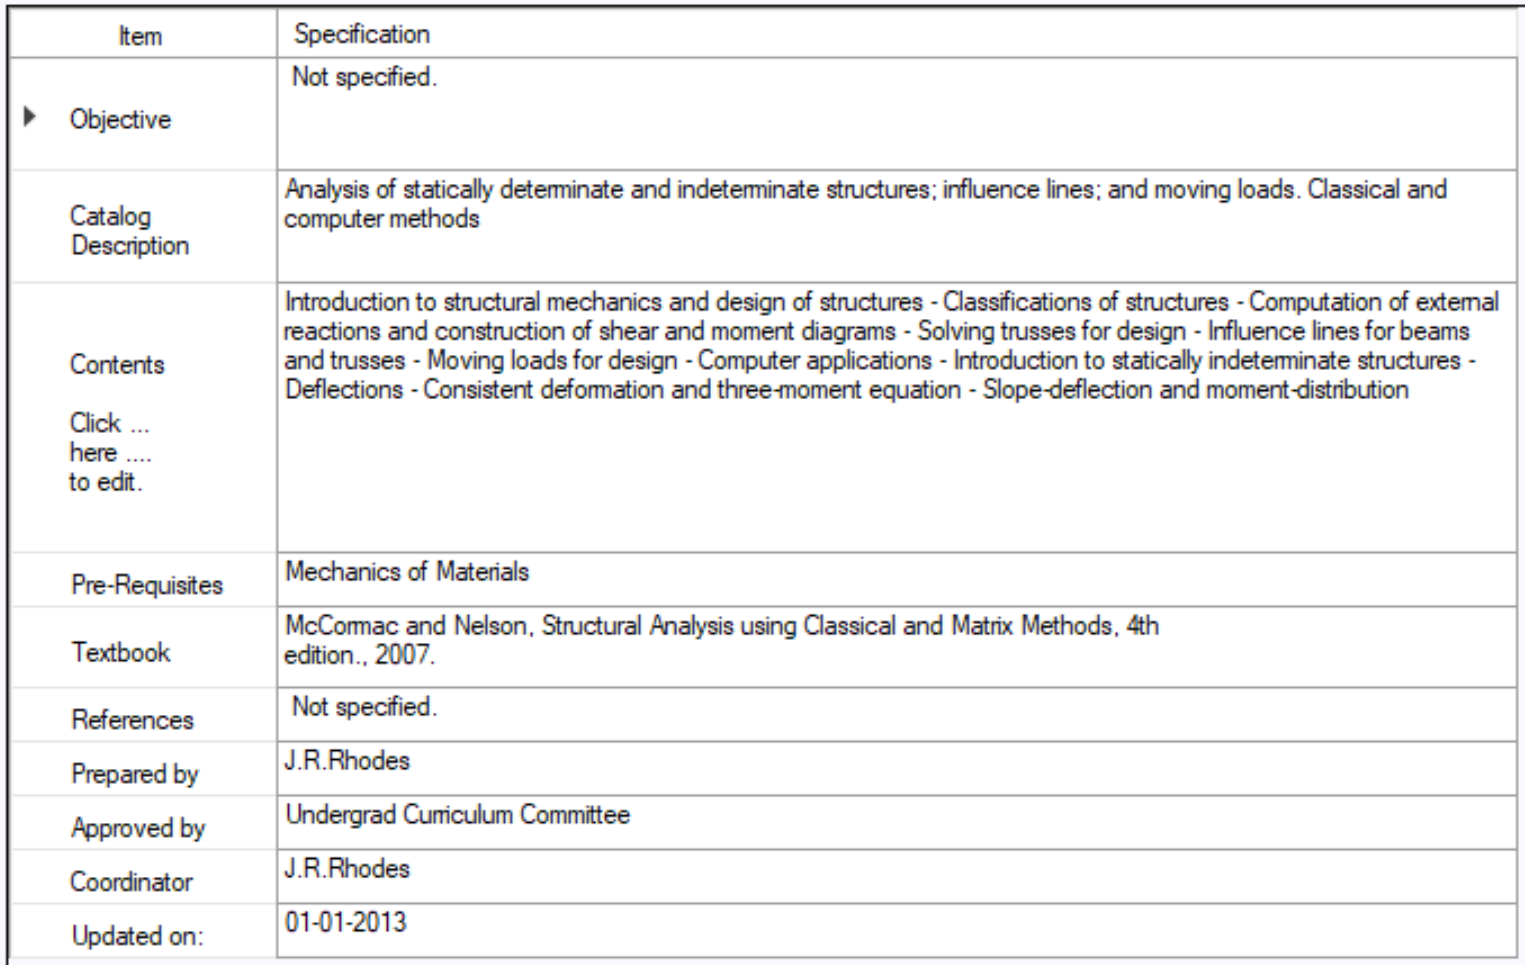
The “Display Material” page has a number of print options. The first one is “Course Syllabus”. The course syllabus contains general information about the course, course objectives, catalog description, course contents, textbook name, reference material, CLOs and the CLO-SO Map.
10.2 Printing Handout for Students
The second in sequence is for printing a handout to be distributed to the students during the first week of classes. This handout contains instructor information, course information such as the syllabus, instruction plan, relevance of the SOs to the course, instruction methods to be used, methods of assessments to be used in the course, types and weights of the assessments for calculating the grades and SO assessment plan.
10.3 Printing Course Folder Part I
Using the third option from the “Display Material” page, the user can print the first part of the course folder. It contains all the information about the course including the instructor information, syllabus, SO relevance, instruction plan, instructional methods, assessment method, types and weights of assessments, SO assessment plan, student survey analysis, and faculty survey results.
10.4 Printing Course Folder Part II
Using the fourth option, the second part of the course folder can be printed. It contains the following:
- 1. A cover page for Assessment Data & Analysis and Assessment Samples
- 2. A page giving details of question-wise point allocations for each assessment
- 3. Question-wise raw scores for all the students for each assessment
- 4. Final grades.
- 5. CLO satisfaction data
- 6. SO satisfaction data
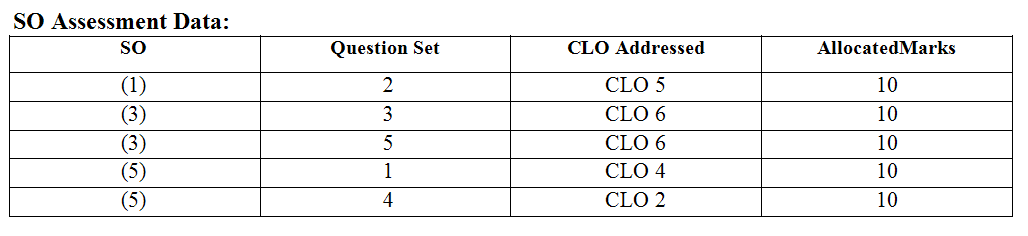
- 7. Cover page for each assessment. The cover page also gives details of the SO assessment data as shown in Fig. 41.
- 8. Scanned copies of question papers, solutions to assessments and student work samples if the instructor has included them using the Student Work Samples option.
10.5 Printing Cover Sheets
Using the controls under Cover Sheets for Student Work Samples, the user can print the cover sheets for the student work samples. This is useful in cases where it is desired to maintain hard copies of student work samples separately.
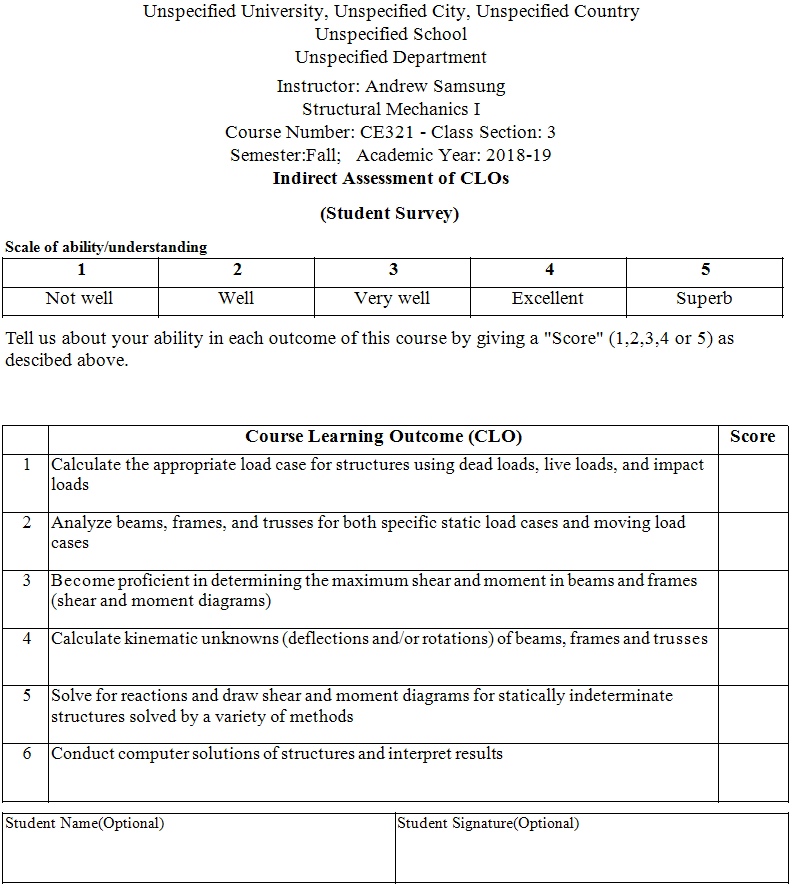
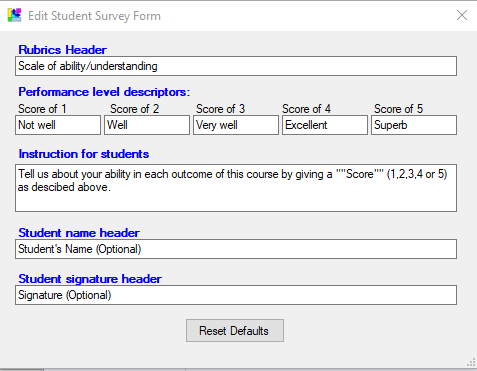
10.6 Printing Student Survey Form
CLOSO prints a form for student survey. A sample printed form is shown in Fig. 42. The information on this survey form can be modified by clicking the “Customize” button that displays the page shown in Fig. 43.
11 ADMIN LICENSE
The Admin Panel license is for a single PC to be used by the CLOSO Administrator of the department. To obtain the Admin license, generate the PC identification file for your PC by clicking the “PC Identification” icon on the main page of CLOSO. Send the PC Identification file produced by CLOSO to Sales@Smart-accredit.com. The PC identification file will be used to generate the Admin License file for you. After you receive the Admin License, you can activate it. The procedure to generate the PC Identification file and to activate the Admin License is described in the following:
Step 1: PC Identification file
- a) Open CLOSO
- b) Click the PC Identification icon.
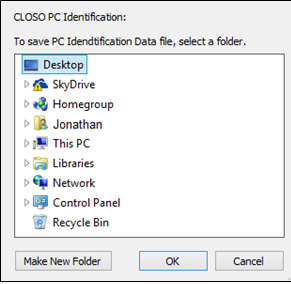
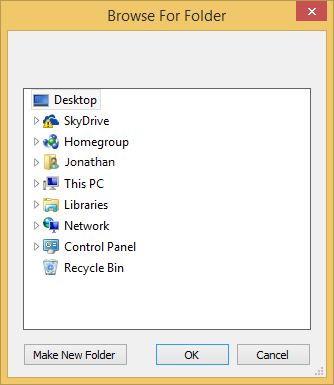
- c) A folder browser will appear as shown in Fig. 44.
- d) Browse to the folder of your choice to store the PC identification file that will be created by CLOSO.
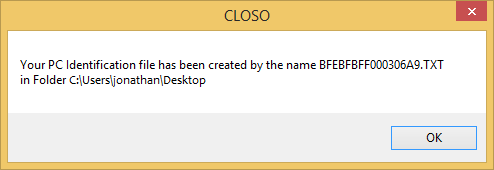
- e) A message will be displayed as shown in Fig. 45.
Step 2: Obtain License File
- a) Send the PC identification file to: sales@smart-accredit.com.
- b) Smart-accredit.com will create a license file.
- c) The license file will be sent to you by email.
- d) The license file name will be: CLOSO1-Admin.LIC
- e) Download this file from your email to any folder on your PC
Step 3: Activate the license
- a) Select Activate Admin Panel icon.
- b) A window as shown in Fig. 46 appears.
- c) Click “Authorize” button.
- d) Browse to the license file CLOSO1-Admin.LIC and click “Open”.
- e) A message will be displayed indicating successful activation.
12 ADMIN PANEL
Click the CLOSO Administrator icon on the CLOSO main window. The CLOSO Admin Panel will appear as shown in Fig. 47.
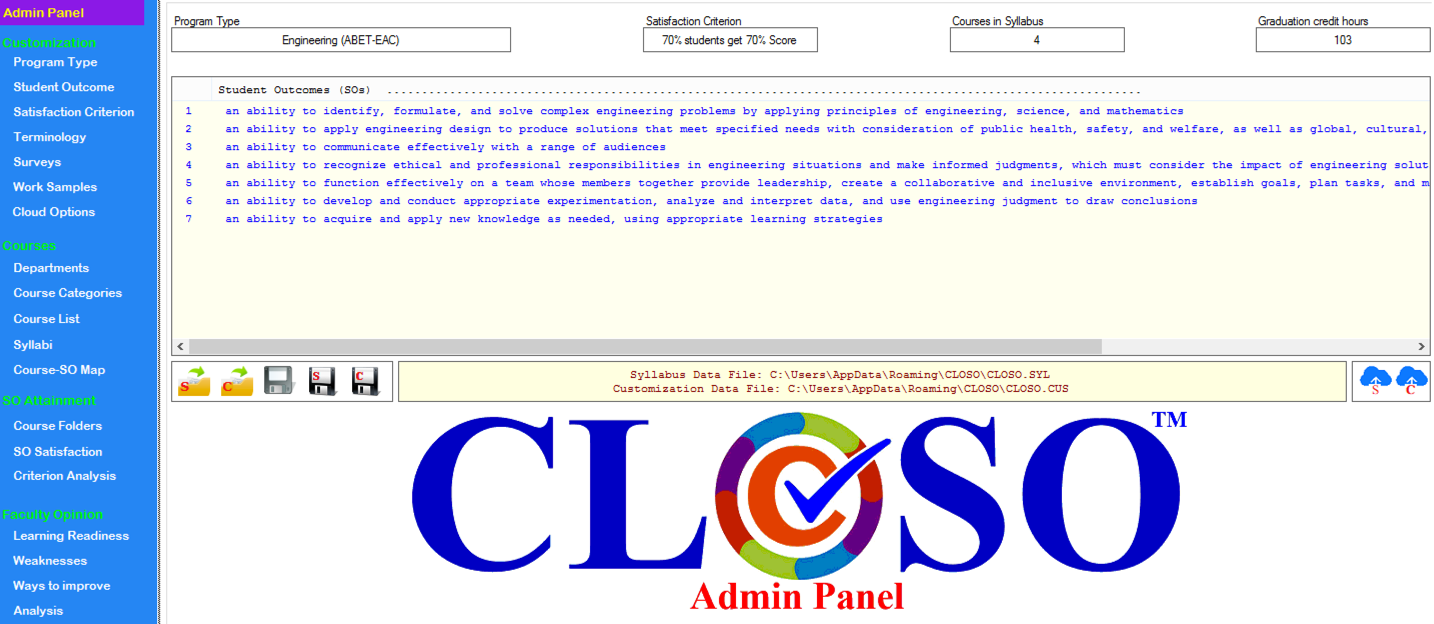
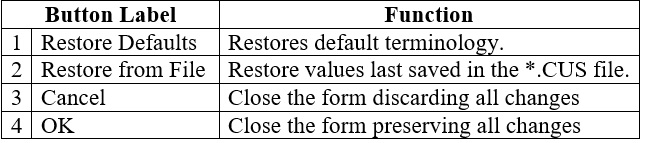
Table 5 gives the functionality of these buttons.
13 CUSTOMIZE
The CLOSO Administrator for the department can customize the terminology and survey items as required by the academic program.
14 SYLLABUS
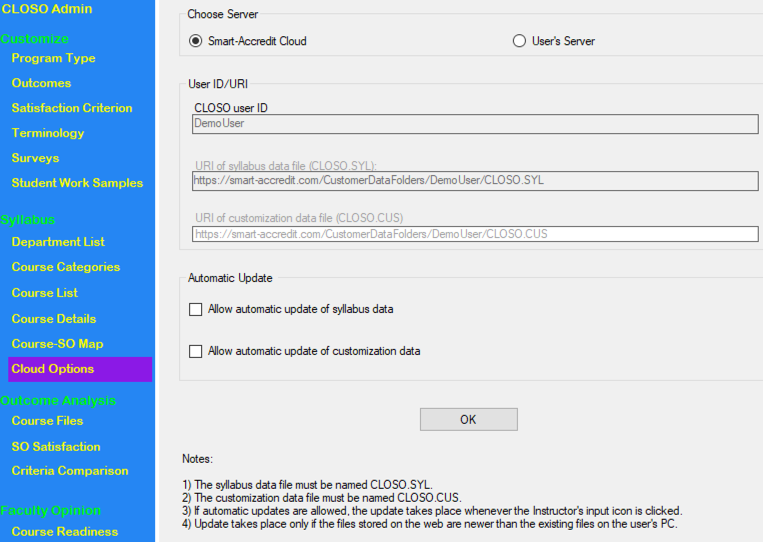
The CLOSO Admin maintains a unified database that contains the syllabi of all courses in the curriculum of an academic program. The CLOSO Administrator can add, delete or modify courses. Since courses in a program may be offered by different departments, a list of departments is maintained in the Department List. Courses can be categorized in the different categories defined by ABET using Course Categories. The Course List page is used to update and maintain the course list and the Course Details page is used to modify contents of courses. The Course-SO map can be generated by clicking Course-SO Map. Syllabus update can be done either online or offline. These options can be set using Cloud Options. Details of all these features are described in the following.
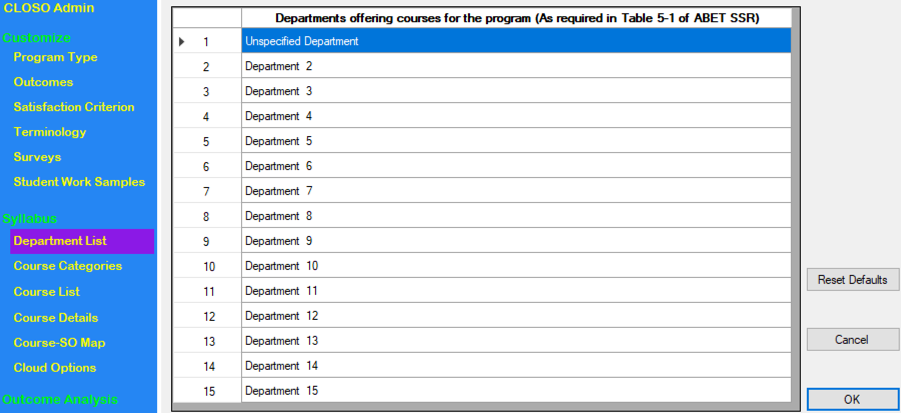
14.1 Departments
A list of departments offering the courses is maintained here. The first name appearing in this list is of the primary department offering the program. Up to 15 names can be added and/or modified. The Department List page is shown in Fig. 57.
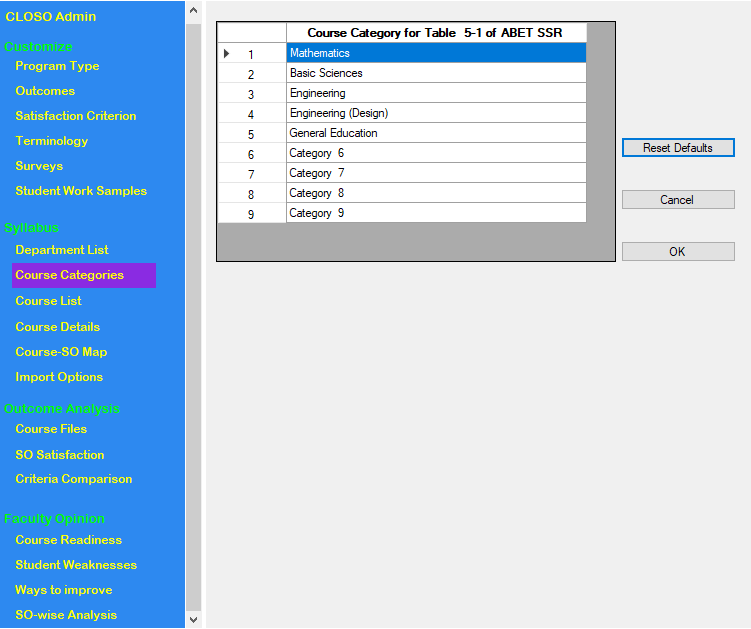
14.2 Course Categories
Courses in the syllabus can be placed in different categories. Four categories are predefined in CLOSO, as shown in Fig. 58. These categories are based upon ABET requirements and can be modified. Up to a maximum of nine course categories can be maintained in CLOSO.
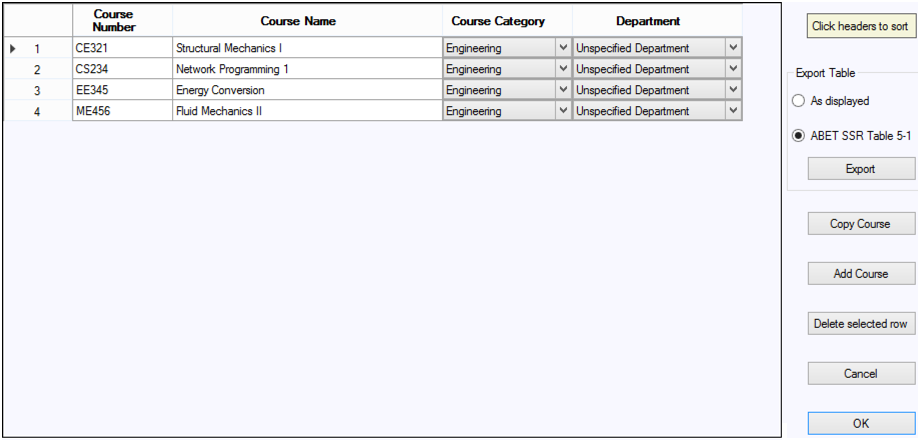
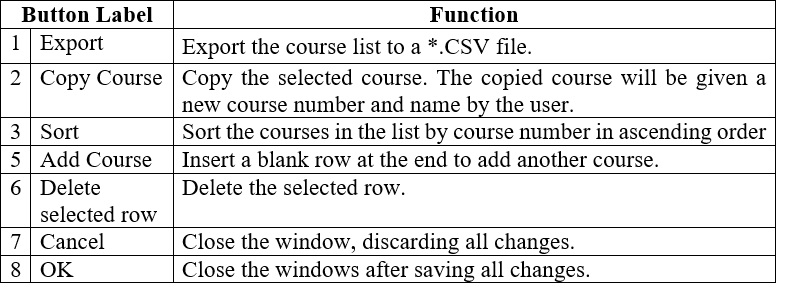
14.3 Course List
Figure 59 shows the course list. Table 8 shows the functionality of each button on the page. The last two columns in the course list editor are used to select the category and the department of each course.
14.4 Syllabi
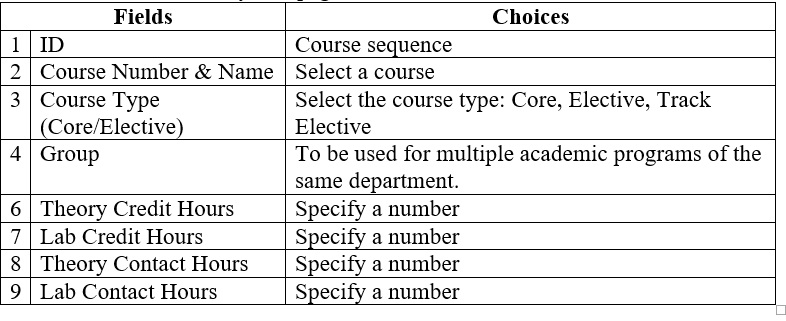
Fig. 60 shows the syllabus editor. There are eight data entry fields in the top part of this window. Table 9 describes the available choices for each of these fields. Detailed course information, CLOs and the CLO-SO map can be entered on this page.
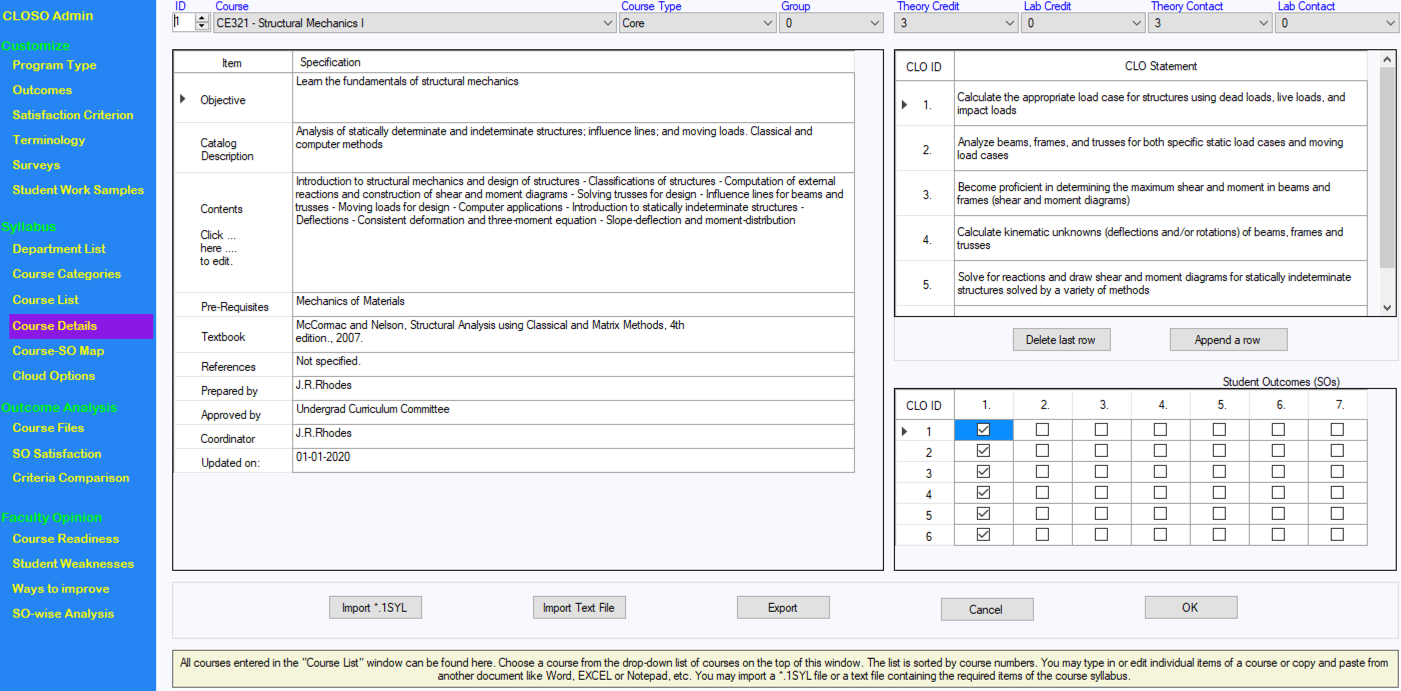
Entering the Course Description
There are ten items in the course description as shown in Fig. 61. These items can be entered either by typing directly in the space provided for each item or by pasting from other applications (such as word processors or spreadsheets).
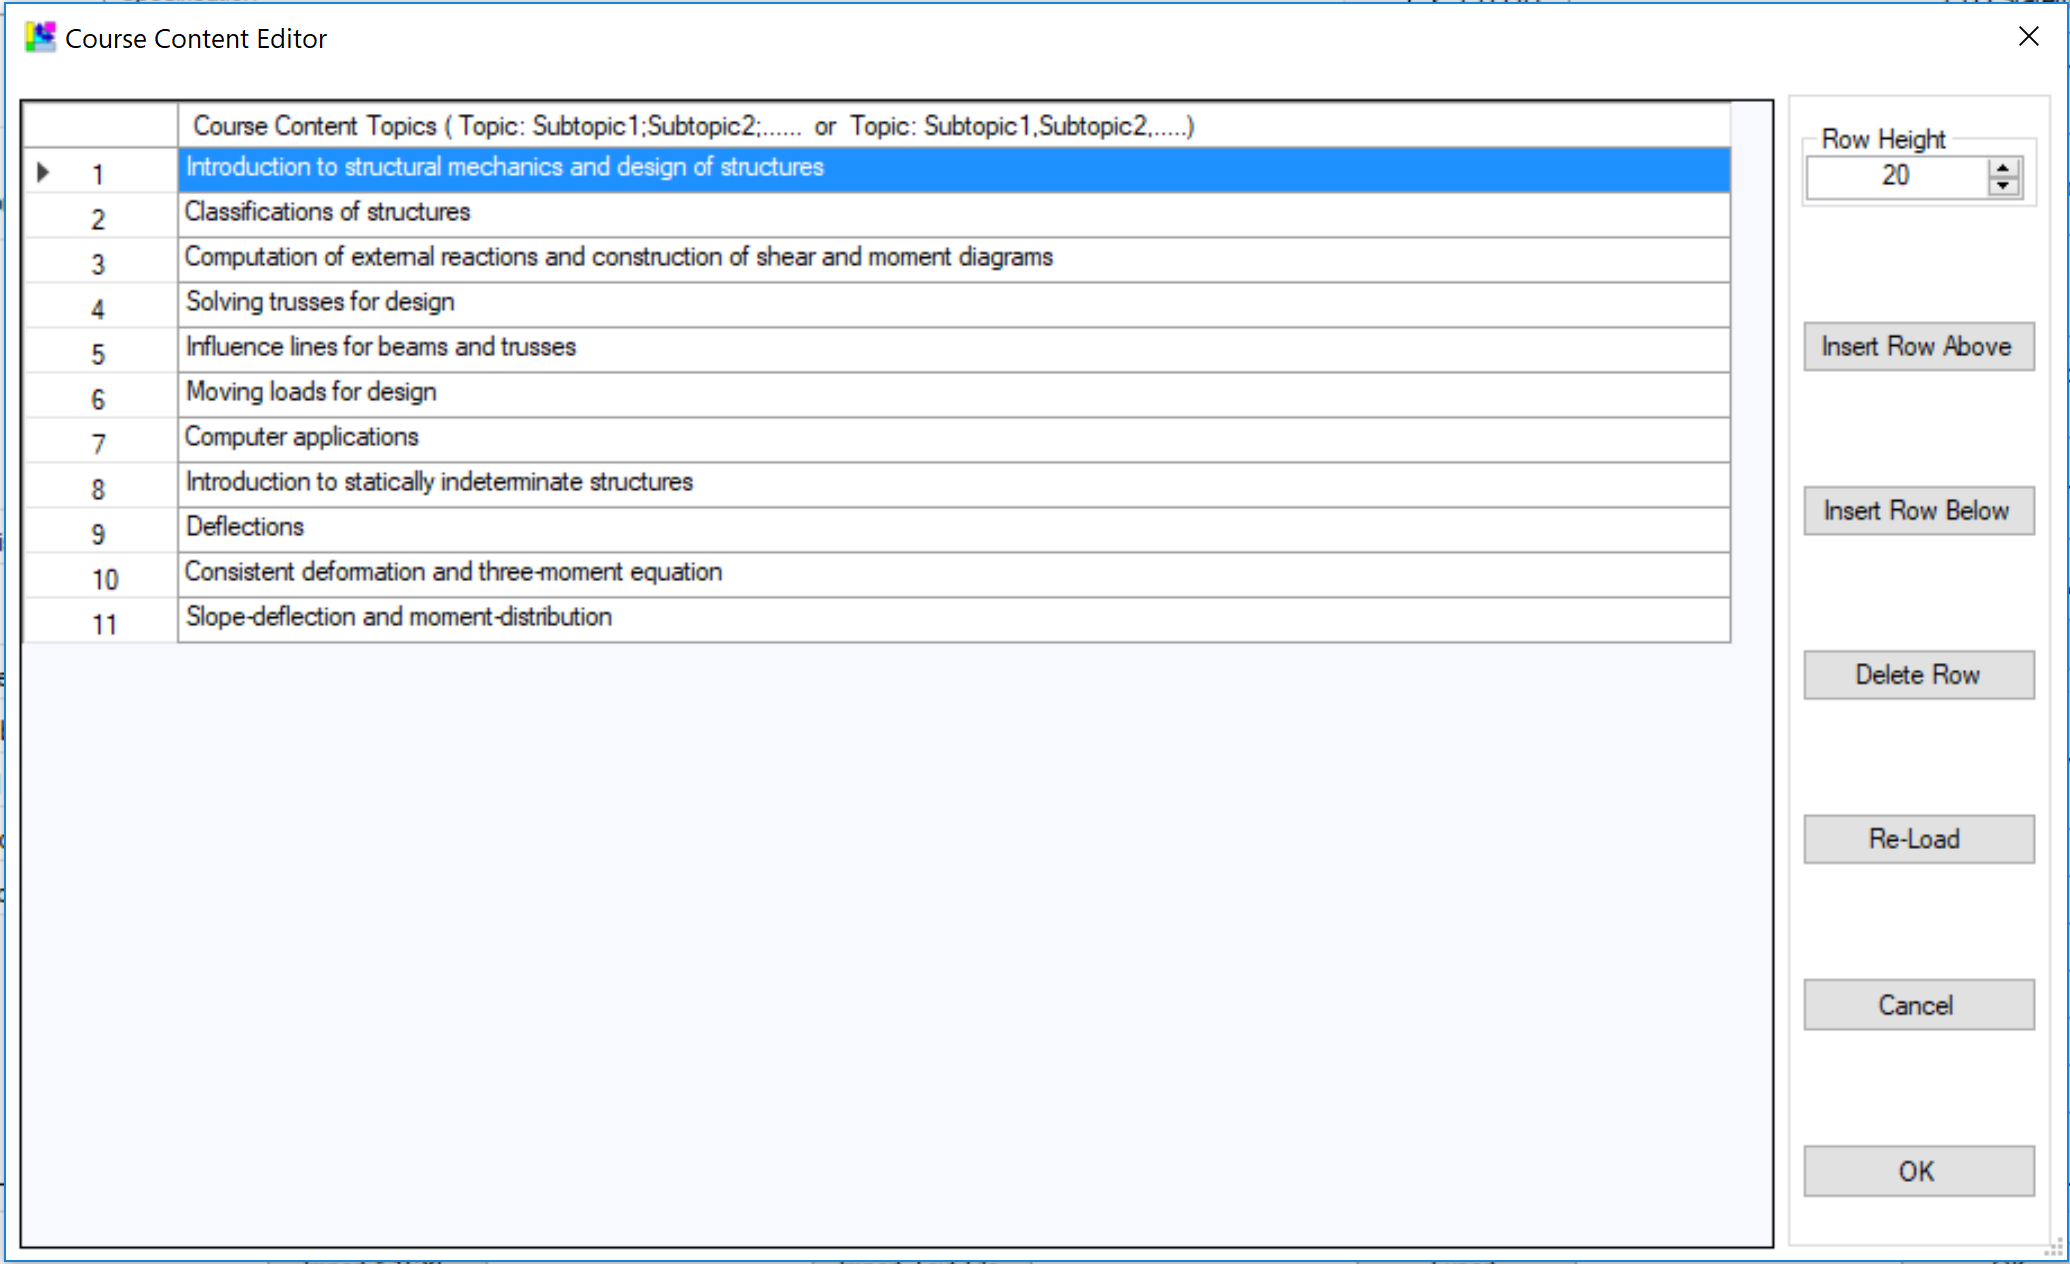
To enter text under the field “Contents”, click “Contents”. Another window will open, as shown in Fig. 62. Each row contains a topic. Subtopics are separated by either semicolons or commas. Rows can be added or deleted by using the buttons on the right. The “Re-load” button restores the saved course contents from the syllabus file, discarding any changes made by the user.
A previously saved Course Description may be imported. If it is a CLOSO syllabus file (*.1SYL), click the “Import *.1SYL” button. If it is a text file, click the “Import Text File” button. The required format and structure of such a text file is described in Section 4.5.
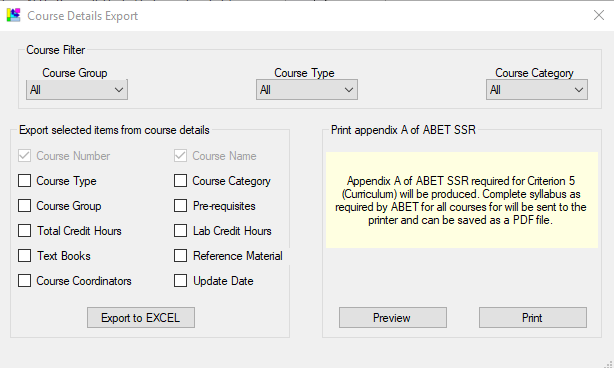
Course details of all courses can also be exported as a CSV file. Click the “Export” button. A dialog box will open, as shown in Fig. 63. Select the items to be exported and click on “Export to EXCEL”. Enter the file name and click “Save”.
Entering Course Learning Outcomes
The Course Learning Outcomes (CLOs) can be typed in or by pasted from other applications as shown in Fig. 64.
Entering CLO-SO Map
The CLO-SO map is entered as shown in Fig. 65. Click a cell to check or uncheck.
14.5 Course-SO Map
The Student Outcomes covered by the courses of the program can be displayed by navigating to the “Course-SO Map” tab in the left panel menu as shown in Fig. 66. The course-SO map can be exported as a CSV file by clicking the “Export” button.
15 EVALUATION
Assessment data submitted by instructors can be analyzed in the Admin Panel. Instructors’ opinions are summarized in the form of tables for the ABET SSR.
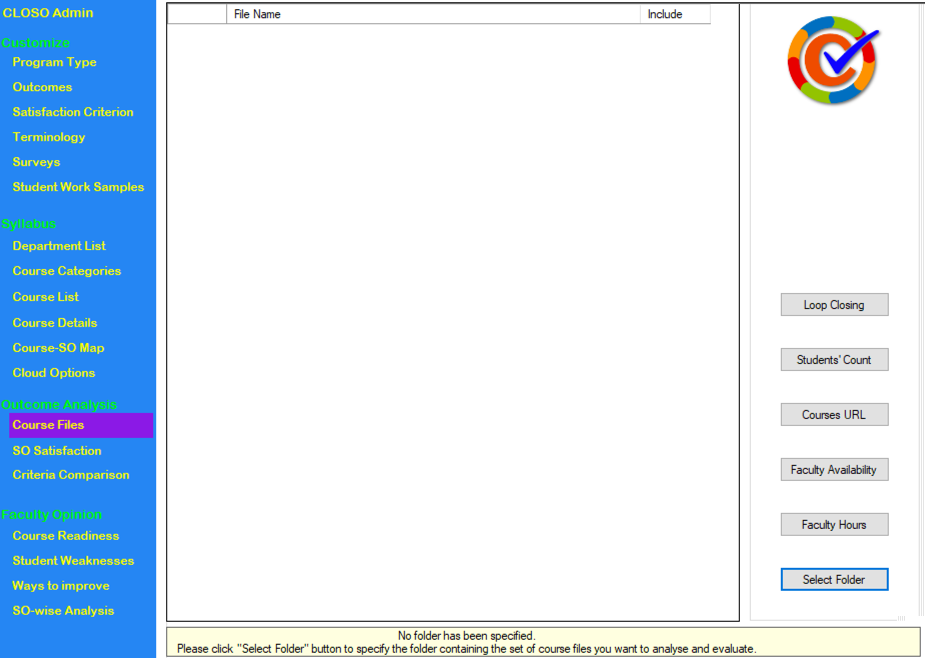
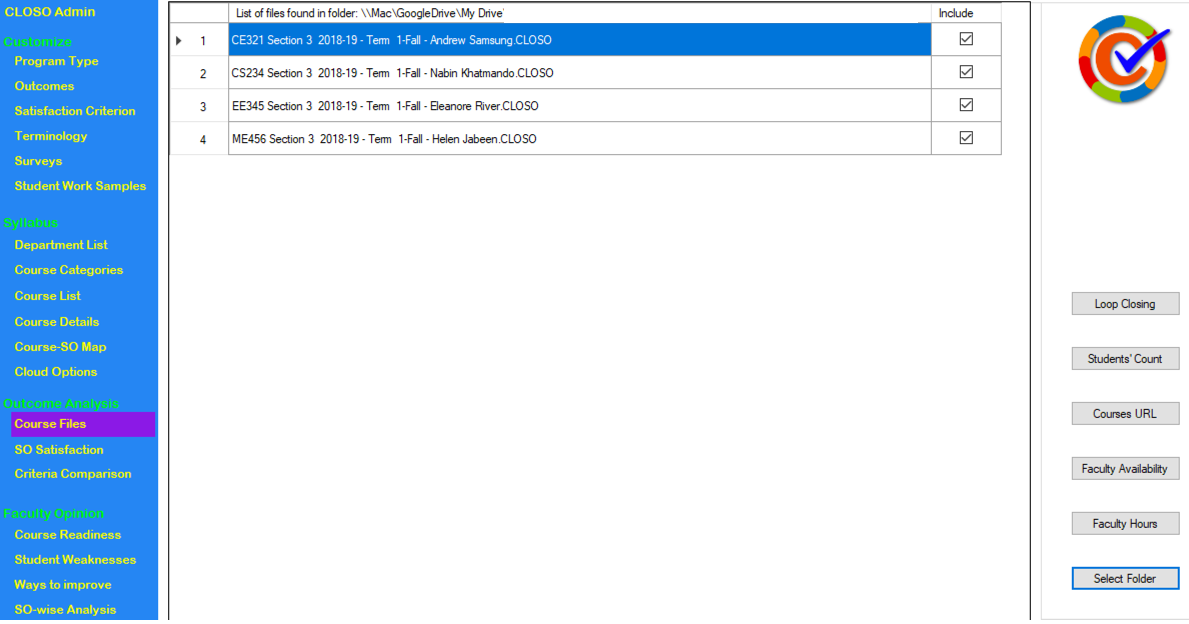
To begin analysis of assessment data, click “Course Folders” in the left panel menu. Course Folders page will open as shown in Fig. 67. Click “Select Folder” to open a dialog box like that shown in Fig. 68. Select the folder containing all the course folders to be analyzed and click “OK”. Course folders in the selected folder will be shown in the table as shown in Fig. 69: List of files for analysis. To exclude a file from the analysis, uncheck the checkbox next to the filename.
15.1 Outcome Analysis
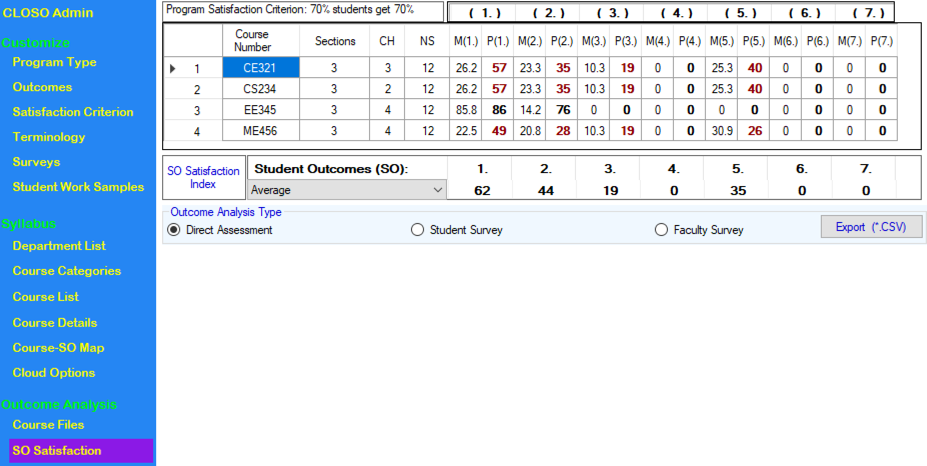
To perform outcome analysis, click “SO Satisfaction” in the left panel menu. CLOSO will process the data from the set of course folders displayed in the “Course Folders” page. Student Outcome data will be displayed as shown in Fig. 70. The first four columns display the Course ID, Section, Credit Hours (CH), and Number of Students (NS). The rest of the columns display the SO satisfaction data. Each pair of columns relates to one of the SOs.
CLOSO performs outcome analysis of the direct assessments by default. Outcome analysis from indirect assessments can be
displayed by selecting “Student Survey” or “Faculty Survey” at the bottom of the table. When “Student Survey” is selected,
the student survey data is displayed. Likewise, when “Faculty Survey” is selected, the faculty survey data is displayed.
CLOSO displays five different ways of aggregates of the assessment data as follows:
- • Average
- • Maximum
- • Weighted: NS
- • Weighted: NS, Mi
- • Weighted: NS, Mi, CH
There are three types of weighted averages. ‘Weighted: NS’, average is weighted by number of students. ‘Weighted: NS, Mi’ is weighted on number of students and the score allocated to a course for the given SO. ‘Weighted: NS, Mi, CH’ is weighted on number of students, the score allocated to a course for the given SO and the credit hours for the courses.
Criterion Analysis
Clicking “Criterion Analysis” opens the page, as shown in Fig. 71, where the results based on different satisfaction criteria can be viewed and compared. The satisfaction data is displayed for one SO at a time. The SO can be selected using the selection bar provided at the top of the window.
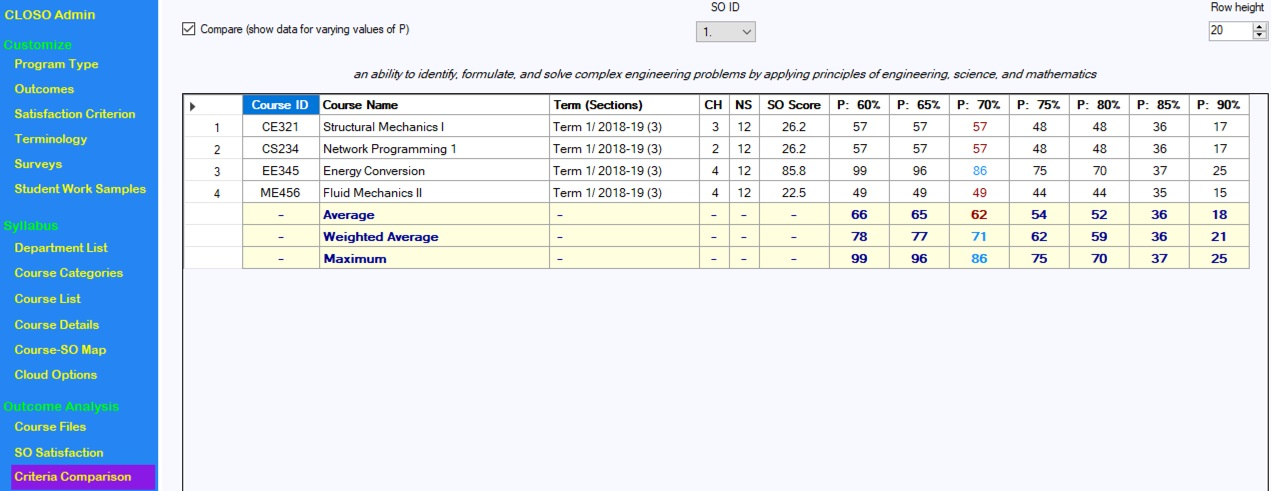
The first four columns in the window display the Course ID, Course Name, Term (Sections), CH (credit hours) and NS (number of students). The fifth column displays the scores associated with the selected SO. The remaining columns display the percentage of students with scores that fall in the following categories: 60% or higher, 65% or higher, 70% or higher, 75% or higher, 80% or higher, 85% or higher, and 90% or higher.
The last three rows (highlighted yellow) display a summary of the data by taking the simple average, weighted average, and the highest value for each column.
15.2 Faculty Opinion
“Faculty Opinion” pages analyze the results from the faculty surveys as described in the following.
Course Readiness
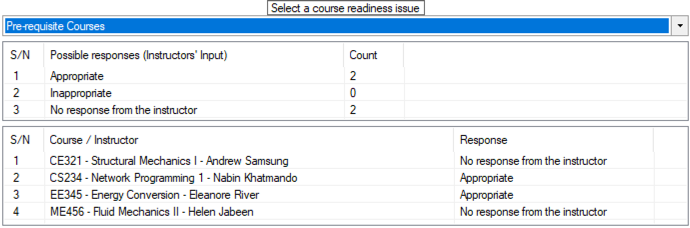
The “Course Readiness” page is shown in Fig. 72. This page displays instructors’ responses for each item of course readiness. - A course readiness item can be chosen using the selection bar at the top.
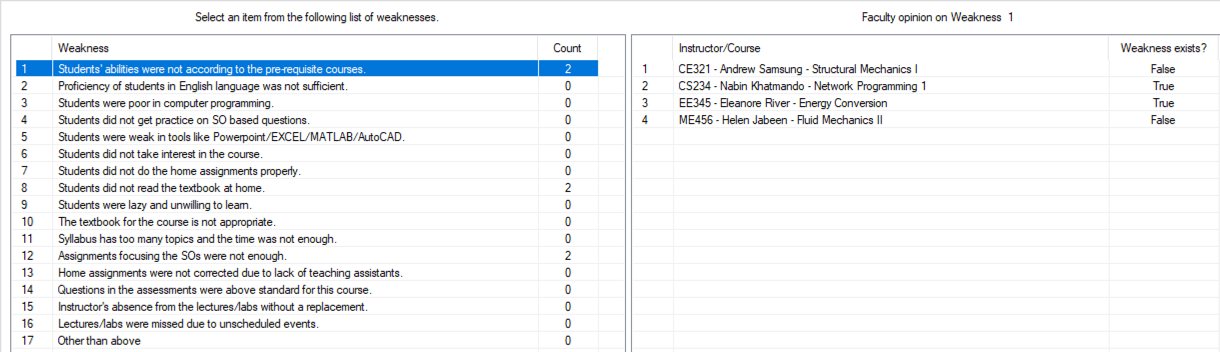
Student Weaknesses
Clicking “Student Weaknesses” from the left panel menu opens the page as shown in Fig. 73. This option summarizes the instructors’ responses to questions about students’ weaknesses. A particular weakness can be selected from this table. Individual response of each instructor pertaining to the selected weakness appears in the table on the right. The counts appear in the table on the left.
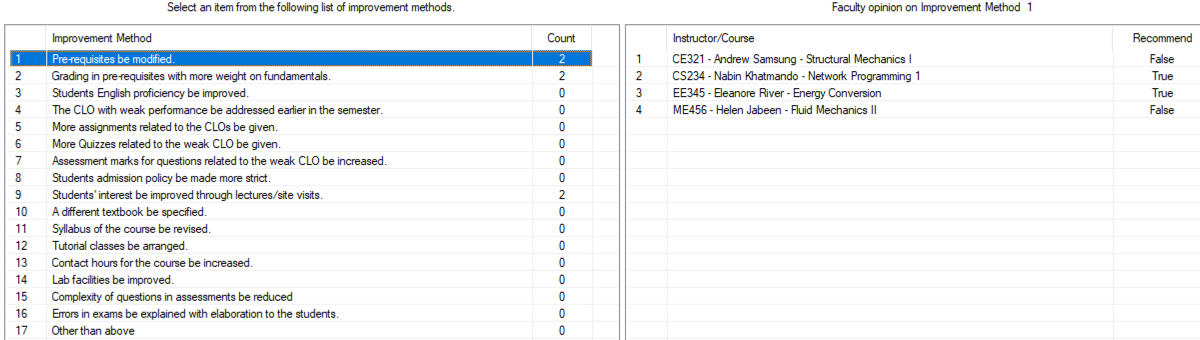
Ways to Improve
Clicking “Ways to Improve” from the left panel menu opens the page as shown in Fig. 74. This page displays the statistics about ways to improve similar to the “Student Weaknesses” page.
Analysis
Clicking “Analysis” from the left panel menu opens the page shown in Fig. 75. This page has four tabs: Outcome Introduction, Loop Closing, Weakness Analysis and Improvement Methods Analysis. These are described in the following.
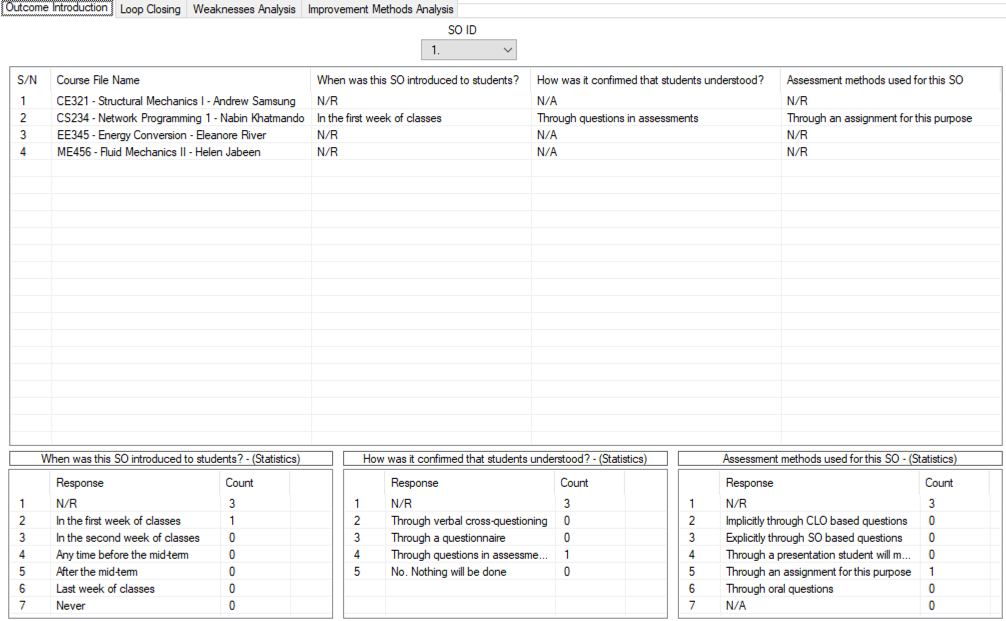
SO wise Outcome Introduction
This is the first tab on SO-wise Analysis page. It summarizes responses about the manner in which SOs were introduced to students. A SO can be selected using the selection bar shown at the top. The statistics of instructors’ responses is displayed in the tables shown at the bottom of the page. In these tables, “N/R” represents “No Response”.
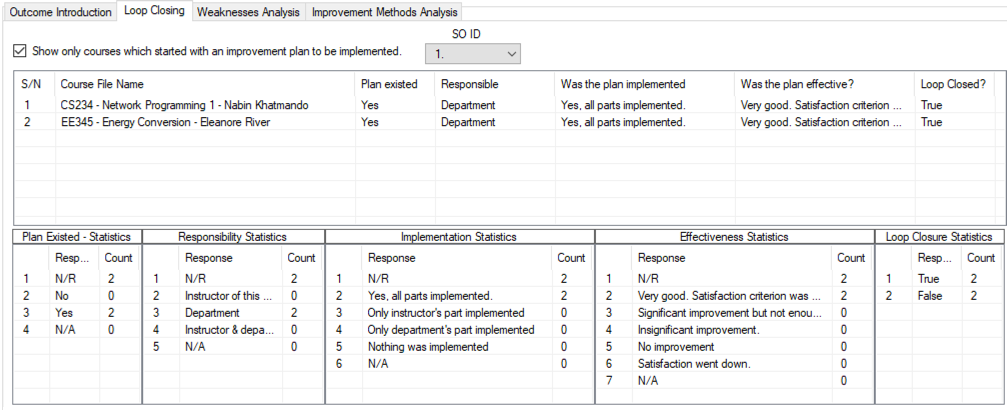
SO wise Loop Closing
The loop closing page is shown in Fig. 76. Similar to Outcome Introduction, the instructor responses are displayed for each SO. A SO can be chosen using the selection bar shown at the top. The upper table summaries individual responses from the instructors. The tables at the bottom display the statistics for these responses.
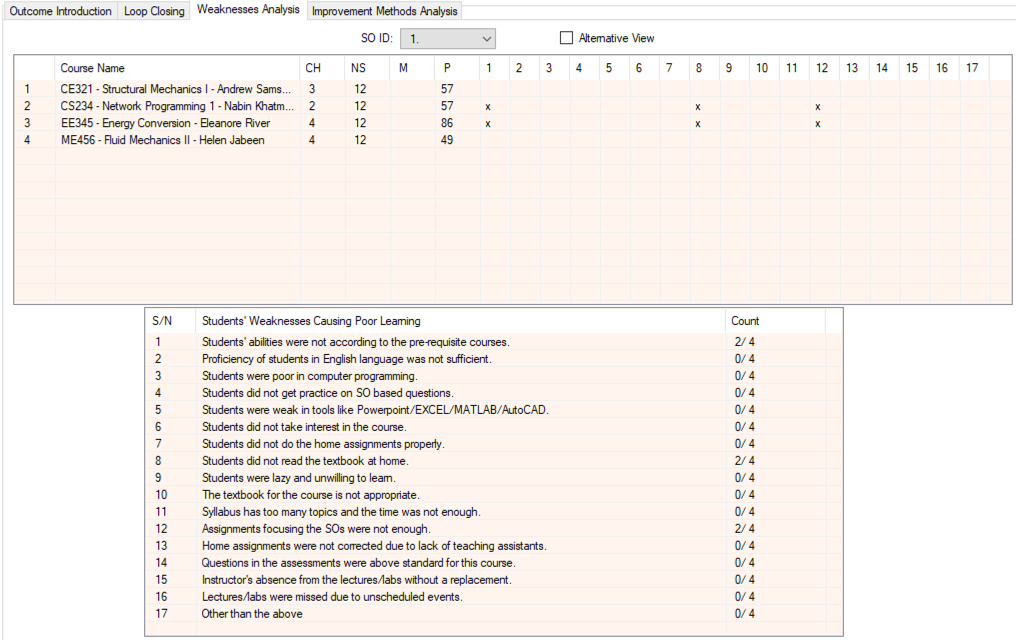
SO wise Weakness Analysis
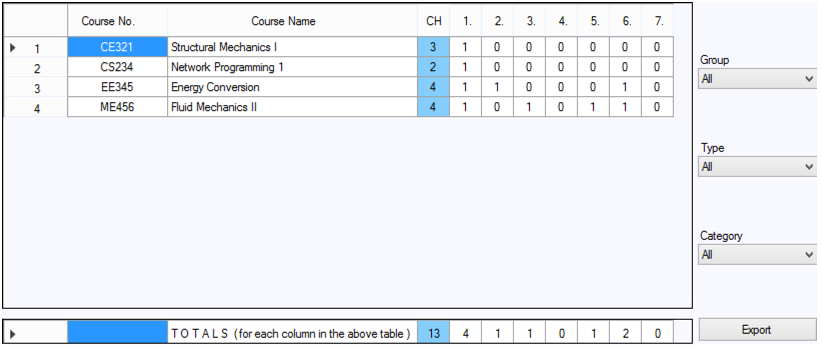
“SO-wise Weakness Analysis” page is shown in Fig. 77. The analysis is displayed for each SO. A SO can be selected using the selection bar at the top. The upper table displays basic information about the course along with the ID numbers of the weaknesses identified in each course. For example, in the course “Structural Mechanics”, weaknesses 2, 3, 7, 8 and 9 were identified by the instructor. The lower table enlists all the weaknesses and gives a count for each. For example, the first weakness was identified by two out of a total of four courses, and the second weakness was identified by all the instructors.
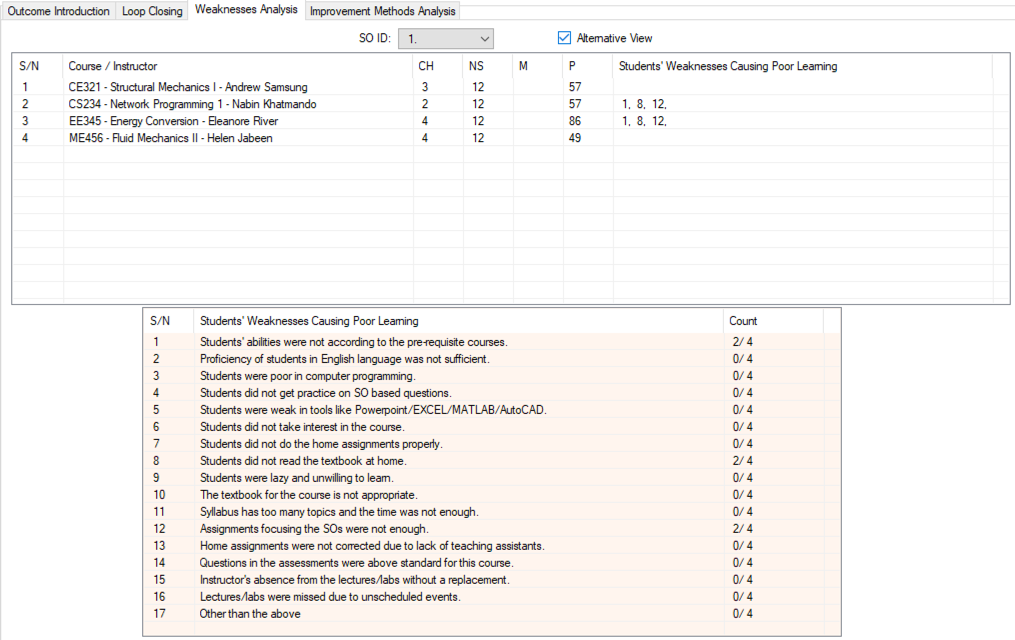
A more compact view of the upper table can be obtained by checking the box beside the SO selection bar. This shows a table with a different format, as shown in Fig. 78. In this view, ID numbers of student weaknesses for each course are shown in a single row, separated by commas. The other table at the bottom of the window remains the same.
SO wise Improvement Methods Analysis
“Improvement Methods Analysis” page is shown in Fig. 79. A more compact view of the upper table can be displayed by checking the option. This alternate view is shown in Fig. 80.